| Multiple Linear Regression - Estimated Regression Equation |
| Y[t] = + 4.10695106045493 + 0.218386375569317X[t] + 0.777029829453182Y1[t] + 2.90011676027211M1[t] + 2.73605265757977M2[t] + 2.83169003558597M3[t] + 6.24422789198119M4[t] + 1.62928897653466M5[t] + 4.27991344256131M6[t] + 0.984204629583514M7[t] -1.71621086446030M8[t] -8.89832924544343M9[t] -0.780062755102813M10[t] -4.41660041423161M11[t] -0.0270101800160684t + e[t] |
| Multiple Linear Regression - Ordinary Least Squares | |||||
| Variable | Parameter | S.D. | T-STAT H0: parameter = 0 | 2-tail p-value | 1-tail p-value |
| (Intercept) | 4.10695106045493 | 14.385418 | 0.2855 | 0.776605 | 0.388303 |
| X | 0.218386375569317 | 0.112462 | 1.9419 | 0.058572 | 0.029286 |
| Y1 | 0.777029829453182 | 0.086773 | 8.9547 | 0 | 0 |
| M1 | 2.90011676027211 | 2.065918 | 1.4038 | 0.1674 | 0.0837 |
| M2 | 2.73605265757977 | 2.118924 | 1.2912 | 0.203361 | 0.101681 |
| M3 | 2.83169003558597 | 2.060335 | 1.3744 | 0.176283 | 0.088141 |
| M4 | 6.24422789198119 | 2.102023 | 2.9706 | 0.004801 | 0.0024 |
| M5 | 1.62928897653466 | 2.443118 | 0.6669 | 0.508325 | 0.254163 |
| M6 | 4.27991344256131 | 2.301956 | 1.8593 | 0.069687 | 0.034843 |
| M7 | 0.984204629583514 | 2.416872 | 0.4072 | 0.685819 | 0.34291 |
| M8 | -1.71621086446030 | 2.602141 | -0.6595 | 0.512988 | 0.256494 |
| M9 | -8.89832924544343 | 2.782186 | -3.1983 | 0.002563 | 0.001281 |
| M10 | -0.780062755102813 | 2.203139 | -0.3541 | 0.724979 | 0.362489 |
| M11 | -4.41660041423161 | 2.166337 | -2.0387 | 0.047512 | 0.023756 |
| t | -0.0270101800160684 | 0.050675 | -0.533 | 0.59671 | 0.298355 |
| Multiple Linear Regression - Regression Statistics | |
| Multiple R | 0.948824809745246 |
| R-squared | 0.900268519588102 |
| Adjusted R-squared | 0.86853577582068 |
| F-TEST (value) | 28.370333375091 |
| F-TEST (DF numerator) | 14 |
| F-TEST (DF denominator) | 44 |
| p-value | 0 |
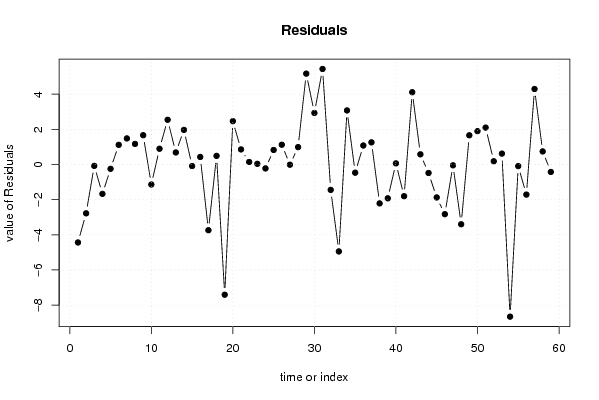
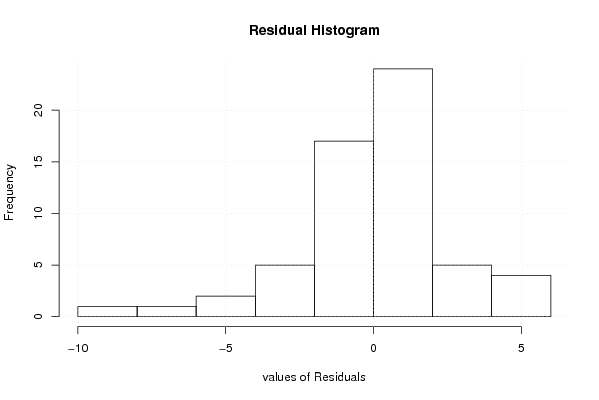
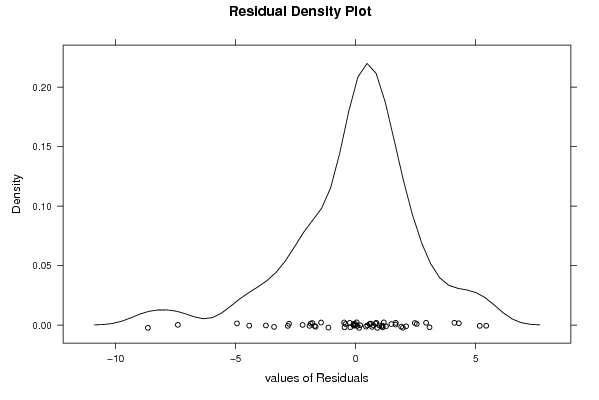
| Multiple Linear Regression - Residual Statistics | |
| Residual Standard Deviation | 2.99332082126786 |
| Sum Squared Residuals | 394.238659717571 |
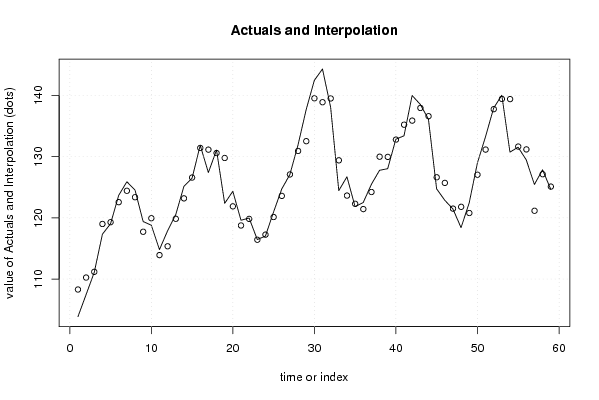
| Multiple Linear Regression - Actuals, Interpolation, and Residuals | |||
| Time or Index | Actuals | Interpolation Forecast | Residuals Prediction Error |
| 1 | 103.86 | 108.294287043486 | -4.43428704348628 |
| 2 | 107.47 | 110.247161779333 | -2.77716177933291 |
| 3 | 111.1 | 111.177227919082 | -0.0772279190820975 |
| 4 | 117.33 | 118.999433055589 | -1.66943305558926 |
| 5 | 119.04 | 119.285734347848 | -0.245734347847702 |
| 6 | 123.68 | 122.561071877958 | 1.11892812204165 |
| 7 | 125.9 | 124.416153197726 | 1.48384680227368 |
| 8 | 124.54 | 123.370056469939 | 1.16994353006135 |
| 9 | 119.39 | 117.724803847715 | 1.66519615228506 |
| 10 | 118.8 | 119.936233706459 | -1.13623370645947 |
| 11 | 114.81 | 113.914276800484 | 0.895723199515833 |
| 12 | 117.9 | 115.35638847808 | 2.54361152191997 |
| 13 | 120.53 | 119.844326279297 | 0.685673720703138 |
| 14 | 125.15 | 123.181867801922 | 1.96813219807833 |
| 15 | 126.49 | 126.578309161302 | -0.0883091613023478 |
| 16 | 131.85 | 131.419990922730 | 0.430009077269542 |
| 17 | 127.4 | 131.139469451149 | -3.73946945114928 |
| 18 | 131.08 | 130.589203284333 | 0.490796715666681 |
| 19 | 122.37 | 129.776535862816 | -7.40653586281628 |
| 20 | 124.34 | 121.875400915875 | 2.46459908412482 |
| 21 | 119.61 | 118.752141713060 | 0.85785828694023 |
| 22 | 119.97 | 119.826735383860 | 0.143264616139788 |
| 23 | 116.46 | 116.421079645762 | 0.0389203542384318 |
| 24 | 117.03 | 117.253426951433 | -0.223426951433023 |
| 25 | 120.96 | 120.132667783339 | 0.827332216661246 |
| 26 | 124.71 | 123.584963944418 | 1.1250360555815 |
| 27 | 127.08 | 127.091580304224 | -0.0115803042244265 |
| 28 | 131.91 | 130.920995872764 | 0.989004127236 |
| 29 | 137.69 | 132.521705535050 | 5.16829446494953 |
| 30 | 142.46 | 139.527359047516 | 2.93264095248422 |
| 31 | 144.32 | 138.884656375838 | 5.43534362416217 |
| 32 | 138.06 | 139.502467652014 | -1.44246765201390 |
| 33 | 124.45 | 129.394609738762 | -4.94460973876165 |
| 34 | 126.71 | 123.634694436689 | 3.07530556331136 |
| 35 | 121.83 | 122.295038588588 | -0.465038588588186 |
| 36 | 122.51 | 121.429534538758 | 1.08046546124223 |
| 37 | 125.48 | 124.219539551448 | 1.26046044855211 |
| 38 | 127.77 | 129.983296334223 | -2.21329633422303 |
| 39 | 128.03 | 129.953199011765 | -1.92319901176482 |
| 40 | 132.84 | 132.776402129309 | 0.0635978706908114 |
| 41 | 133.41 | 135.213278059727 | -1.80327805972695 |
| 42 | 139.99 | 135.877549217263 | 4.11245078273666 |
| 43 | 138.53 | 137.951588790312 | 0.578411209688453 |
| 44 | 136.12 | 136.601142884297 | -0.481142884297153 |
| 45 | 124.75 | 126.623988294482 | -1.8739882944816 |
| 46 | 122.88 | 125.705706343468 | -2.82570634346801 |
| 47 | 121.46 | 121.506335500637 | -0.0463355006368328 |
| 48 | 118.4 | 121.800650031729 | -3.40065003172919 |
| 49 | 122.45 | 120.789179342430 | 1.66082065756978 |
| 50 | 128.94 | 127.042710140104 | 1.89728985989611 |
| 51 | 133.25 | 131.149683603626 | 2.10031639637369 |
| 52 | 137.94 | 137.753178019607 | 0.186821980392906 |
| 53 | 140.04 | 139.419812606226 | 0.620187393774412 |
| 54 | 130.74 | 139.394816572929 | -8.65481657292921 |
| 55 | 131.55 | 131.641065773308 | -0.0910657733080271 |
| 56 | 129.47 | 131.180932077875 | -1.71093207787511 |
| 57 | 125.45 | 121.154456405982 | 4.29554359401796 |
| 58 | 127.87 | 127.126630129524 | 0.743369870476339 |
| 59 | 124.68 | 125.103269464529 | -0.423269464529245 |
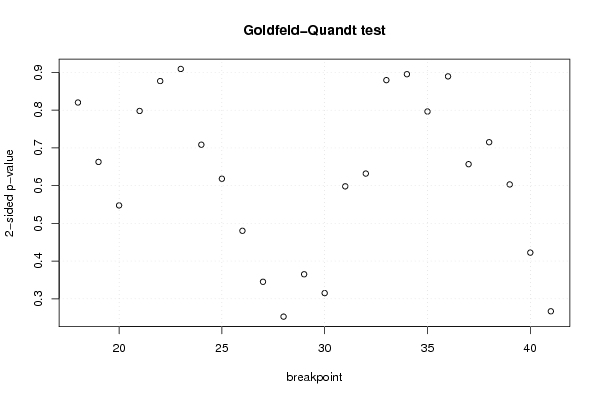
| Goldfeld-Quandt test for Heteroskedasticity | |||
| p-values | Alternative Hypothesis | ||
| breakpoint index | greater | 2-sided | less |
| 18 | 0.410116894075216 | 0.820233788150431 | 0.589883105924784 |
| 19 | 0.668610706200472 | 0.662778587599057 | 0.331389293799528 |
| 20 | 0.726211400802203 | 0.547577198395594 | 0.273788599197797 |
| 21 | 0.601086151295307 | 0.797827697409387 | 0.398913848704693 |
| 22 | 0.561464920311856 | 0.877070159376288 | 0.438535079688144 |
| 23 | 0.454574956963624 | 0.909149913927249 | 0.545425043036376 |
| 24 | 0.354201431940987 | 0.708402863881974 | 0.645798568059013 |
| 25 | 0.309101619628602 | 0.618203239257204 | 0.690898380371398 |
| 26 | 0.240147744554566 | 0.480295489109133 | 0.759852255445434 |
| 27 | 0.172553907064405 | 0.345107814128811 | 0.827446092935595 |
| 28 | 0.126381522733550 | 0.252763045467099 | 0.87361847726645 |
| 29 | 0.182539945510494 | 0.365079891020987 | 0.817460054489506 |
| 30 | 0.157579549709880 | 0.315159099419760 | 0.84242045029012 |
| 31 | 0.299017923072181 | 0.598035846144362 | 0.700982076927819 |
| 32 | 0.315955621732942 | 0.631911243465885 | 0.684044378267058 |
| 33 | 0.439749128130368 | 0.879498256260736 | 0.560250871869632 |
| 34 | 0.447598757601301 | 0.895197515202601 | 0.552401242398699 |
| 35 | 0.398165110875164 | 0.796330221750327 | 0.601834889124836 |
| 36 | 0.444729538894641 | 0.889459077789281 | 0.55527046110536 |
| 37 | 0.328396136594037 | 0.656792273188074 | 0.671603863405963 |
| 38 | 0.357490242300242 | 0.714980484600484 | 0.642509757699758 |
| 39 | 0.301570913985412 | 0.603141827970824 | 0.698429086014588 |
| 40 | 0.211197090117342 | 0.422394180234684 | 0.788802909882658 |
| 41 | 0.133469780763824 | 0.266939561527649 | 0.866530219236176 |
| Meta Analysis of Goldfeld-Quandt test for Heteroskedasticity | |||
| Description | # significant tests | % significant tests | OK/NOK |
| 1% type I error level | 0 | 0 | OK |
| 5% type I error level | 0 | 0 | OK |
| 10% type I error level | 0 | 0 | OK |