| Multiple Linear Regression - Estimated Regression Equation |
| Y[t] = + 75.6032622959898 + 0.445177295463275X[t] + e[t] |
| Multiple Linear Regression - Ordinary Least Squares | |||||
| Variable | Parameter | S.D. | T-STAT H0: parameter = 0 | 2-tail p-value | 1-tail p-value |
| (Intercept) | 75.6032622959898 | 12.450719 | 6.0722 | 0 | 0 |
| X | 0.445177295463275 | 0.110547 | 4.027 | 0.000166 | 8.3e-05 |
| Multiple Linear Regression - Regression Statistics | |
| Multiple R | 0.467448271714007 |
| R-squared | 0.218507886728412 |
| Adjusted R-squared | 0.205033884775453 |
| F-TEST (value) | 16.2169997816005 |
| F-TEST (DF numerator) | 1 |
| F-TEST (DF denominator) | 58 |
| p-value | 0.000166153070633612 |
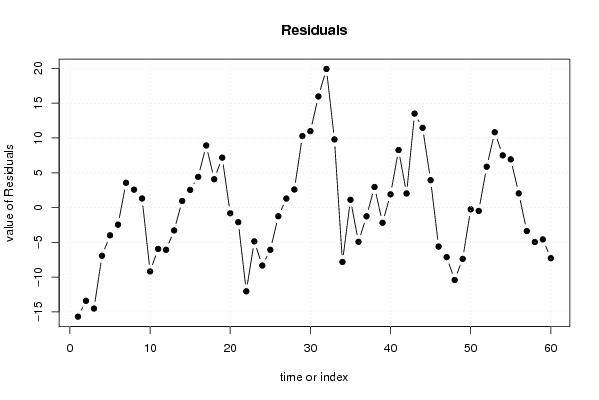
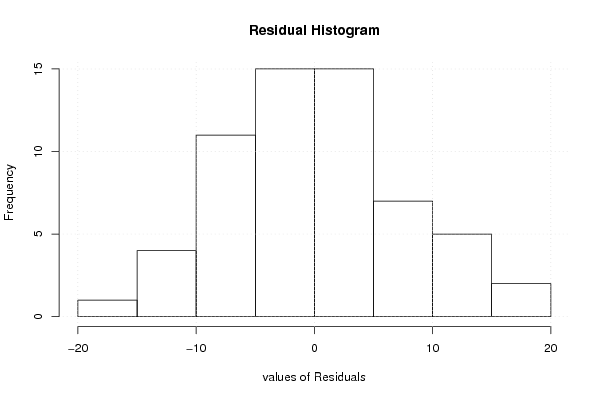
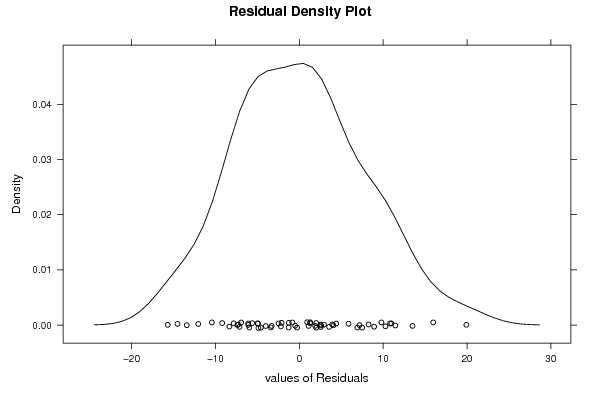
| Multiple Linear Regression - Residual Statistics | |
| Residual Standard Deviation | 7.71995781382273 |
| Sum Squared Residuals | 3456.66942153775 |
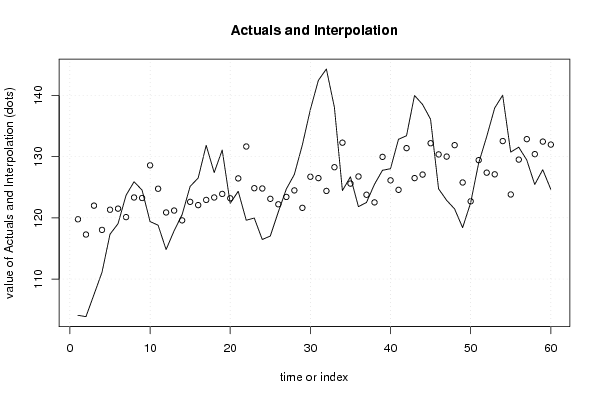
| Multiple Linear Regression - Actuals, Interpolation, and Residuals | |||
| Time or Index | Actuals | Interpolation Forecast | Residuals Prediction Error |
| 1 | 104.08 | 119.764850005946 | -15.6848500059461 |
| 2 | 103.86 | 117.271857151352 | -13.4118571513522 |
| 3 | 107.47 | 121.990736483263 | -14.5207364832629 |
| 4 | 111.1 | 118.028658553640 | -6.92865855363978 |
| 5 | 117.33 | 121.322970540068 | -3.99297054006802 |
| 6 | 119.04 | 121.501041458253 | -2.46104145825331 |
| 7 | 123.68 | 120.120991842317 | 3.55900815768284 |
| 8 | 125.9 | 123.326268369653 | 2.57373163034725 |
| 9 | 124.54 | 123.23723291056 | 1.30276708943991 |
| 10 | 119.39 | 128.579360456119 | -9.1893604561194 |
| 11 | 118.8 | 124.750835715135 | -5.95083571513524 |
| 12 | 114.81 | 120.877793244605 | -6.06779324460474 |
| 13 | 117.9 | 121.189417351429 | -3.28941735142903 |
| 14 | 120.53 | 119.586779087761 | 0.943220912238762 |
| 15 | 125.15 | 122.613984696912 | 2.5360153030885 |
| 16 | 126.49 | 122.079771942356 | 4.41022805764441 |
| 17 | 131.85 | 122.925608803736 | 8.9243911962642 |
| 18 | 127.4 | 123.326268369653 | 4.07373163034725 |
| 19 | 131.08 | 123.904998853755 | 7.175001146245 |
| 20 | 122.37 | 123.192715181014 | -0.822715181013765 |
| 21 | 124.34 | 126.442509437896 | -2.10250943789567 |
| 22 | 119.61 | 131.651083794816 | -12.041083794816 |
| 23 | 119.97 | 124.839871174228 | -4.86987117422788 |
| 24 | 116.46 | 124.795353444682 | -8.33535344468156 |
| 25 | 117.03 | 123.103679721921 | -6.07367972192111 |
| 26 | 120.96 | 122.213325130995 | -1.25332513099457 |
| 27 | 124.71 | 123.415303828745 | 1.29469617125459 |
| 28 | 127.08 | 124.483729337857 | 2.59627066214274 |
| 29 | 131.91 | 121.634594646892 | 10.2754053531077 |
| 30 | 137.69 | 126.709615815174 | 10.9803841848264 |
| 31 | 142.46 | 126.487027167442 | 15.972972832558 |
| 32 | 144.32 | 124.394693878765 | 19.9253061212354 |
| 33 | 138.06 | 128.267736349295 | 9.7922636507049 |
| 34 | 124.45 | 132.274332008465 | -7.82433200846457 |
| 35 | 126.71 | 125.596672576515 | 1.11332742348454 |
| 36 | 121.83 | 126.75413354472 | -4.92413354471997 |
| 37 | 122.51 | 123.771445665116 | -1.26144566511602 |
| 38 | 125.48 | 122.524949237819 | 2.95505076218115 |
| 39 | 127.77 | 129.959410072056 | -2.18941007205555 |
| 40 | 128.03 | 126.130885331071 | 1.89911466892862 |
| 41 | 132.84 | 124.57276479695 | 8.26723520305008 |
| 42 | 133.41 | 131.383977417538 | 2.02602258246197 |
| 43 | 139.99 | 126.487027167442 | 13.502972832558 |
| 44 | 138.53 | 127.065757651544 | 11.4642423484557 |
| 45 | 136.12 | 132.185296549372 | 3.93470345062809 |
| 46 | 124.75 | 130.360069637972 | -5.61006963797249 |
| 47 | 122.88 | 130.003927801602 | -7.12392780160188 |
| 48 | 121.46 | 131.873672442548 | -10.4136724425476 |
| 49 | 118.4 | 125.774743494701 | -7.37474349470076 |
| 50 | 122.45 | 122.703020156004 | -0.25302015600416 |
| 51 | 128.94 | 129.425197317500 | -0.485197317499621 |
| 52 | 133.25 | 127.377381758369 | 5.87261824163145 |
| 53 | 137.94 | 127.110275381091 | 10.8297246189094 |
| 54 | 140.04 | 132.541438385743 | 7.49856161425745 |
| 55 | 130.74 | 123.815963394662 | 6.92403660533766 |
| 56 | 131.55 | 129.514232776592 | 2.03576722340774 |
| 57 | 129.47 | 132.853062492567 | -3.38306249256683 |
| 58 | 125.45 | 130.404587367519 | -4.95458736751882 |
| 59 | 127.87 | 132.45240292665 | -4.58240292664988 |
| 60 | 124.68 | 131.962707901640 | -7.28270790164027 |
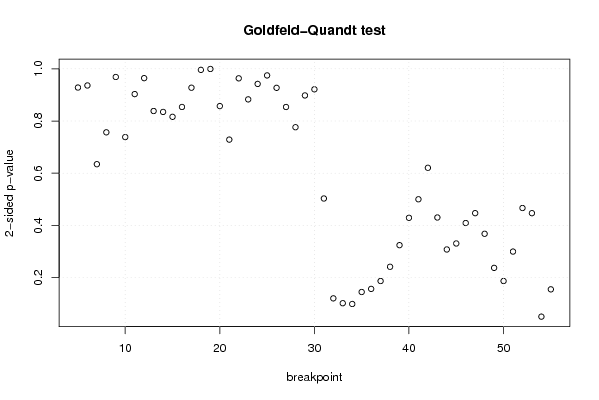
| Goldfeld-Quandt test for Heteroskedasticity | |||
| p-values | Alternative Hypothesis | ||
| breakpoint index | greater | 2-sided | less |
| 5 | 0.464074866588081 | 0.928149733176162 | 0.535925133411919 |
| 6 | 0.468068894637843 | 0.936137789275685 | 0.531931105362157 |
| 7 | 0.682704380847213 | 0.634591238305574 | 0.317295619152787 |
| 8 | 0.621670684760847 | 0.756658630478306 | 0.378329315239153 |
| 9 | 0.515705522080261 | 0.968588955839479 | 0.484294477919739 |
| 10 | 0.630770459484588 | 0.738459081030823 | 0.369229540515412 |
| 11 | 0.548452827016879 | 0.903094345966242 | 0.451547172983121 |
| 12 | 0.482067906371633 | 0.964135812743267 | 0.517932093628367 |
| 13 | 0.419127989484703 | 0.838255978969406 | 0.580872010515297 |
| 14 | 0.417372805040757 | 0.834745610081514 | 0.582627194959243 |
| 15 | 0.408035766449274 | 0.816071532898549 | 0.591964233550726 |
| 16 | 0.426859336100202 | 0.853718672200403 | 0.573140663899798 |
| 17 | 0.53623595541415 | 0.9275280891717 | 0.46376404458585 |
| 18 | 0.497932718845256 | 0.995865437690513 | 0.502067281154744 |
| 19 | 0.499699850456224 | 0.999399700912447 | 0.500300149543776 |
| 20 | 0.42856232177157 | 0.85712464354314 | 0.57143767822843 |
| 21 | 0.364396926429215 | 0.728793852858431 | 0.635603073570784 |
| 22 | 0.481772213274743 | 0.963544426549486 | 0.518227786725257 |
| 23 | 0.441439230610916 | 0.882878461221831 | 0.558560769389084 |
| 24 | 0.471023635481931 | 0.942047270963862 | 0.528976364518069 |
| 25 | 0.487314927989146 | 0.974629855978292 | 0.512685072010854 |
| 26 | 0.463535069625634 | 0.927070139251267 | 0.536464930374366 |
| 27 | 0.426825683341128 | 0.853651366682256 | 0.573174316658872 |
| 28 | 0.388108197218275 | 0.77621639443655 | 0.611891802781725 |
| 29 | 0.448969290205323 | 0.897938580410646 | 0.551030709794677 |
| 30 | 0.539298924438651 | 0.921402151122698 | 0.460701075561349 |
| 31 | 0.74840492672482 | 0.50319014655036 | 0.25159507327518 |
| 32 | 0.939632270777033 | 0.120735458445935 | 0.0603677292229675 |
| 33 | 0.94890637165001 | 0.102187256699979 | 0.0510936283499896 |
| 34 | 0.950427119597304 | 0.0991457608053923 | 0.0495728804026961 |
| 35 | 0.927455409753482 | 0.145089180493036 | 0.0725445902465181 |
| 36 | 0.921548216757754 | 0.156903566484492 | 0.0784517832422459 |
| 37 | 0.906459958019643 | 0.187080083960715 | 0.0935400419803574 |
| 38 | 0.87917969299735 | 0.2416406140053 | 0.12082030700265 |
| 39 | 0.837781370512129 | 0.324437258975741 | 0.162218629487871 |
| 40 | 0.785403192603212 | 0.429193614793577 | 0.214596807396788 |
| 41 | 0.749903784745344 | 0.500192430509312 | 0.250096215254656 |
| 42 | 0.689602656091884 | 0.620794687816231 | 0.310397343908116 |
| 43 | 0.784771636899865 | 0.430456726200271 | 0.215228363100135 |
| 44 | 0.84599277880156 | 0.308014442396879 | 0.154007221198439 |
| 45 | 0.834535539727775 | 0.330928920544451 | 0.165464460272225 |
| 46 | 0.795379276448852 | 0.409241447102296 | 0.204620723551148 |
| 47 | 0.776484344168368 | 0.447031311663263 | 0.223515655831632 |
| 48 | 0.815976145226342 | 0.368047709547316 | 0.184023854773658 |
| 49 | 0.881272454009385 | 0.237455091981231 | 0.118727545990615 |
| 50 | 0.906423478126046 | 0.187153043747909 | 0.0935765218739545 |
| 51 | 0.850043853887375 | 0.299912292225249 | 0.149956146112625 |
| 52 | 0.766616264371847 | 0.466767471256307 | 0.233383735628153 |
| 53 | 0.776501785254089 | 0.446996429491823 | 0.223498214745911 |
| 54 | 0.97467485963321 | 0.0506502807335799 | 0.0253251403667900 |
| 55 | 0.922347561632014 | 0.155304876735971 | 0.0776524383679855 |
| Meta Analysis of Goldfeld-Quandt test for Heteroskedasticity | |||
| Description | # significant tests | % significant tests | OK/NOK |
| 1% type I error level | 0 | 0 | OK |
| 5% type I error level | 0 | 0 | OK |
| 10% type I error level | 2 | 0.0392156862745098 | OK |