| Multiple Linear Regression - Estimated Regression Equation |
| y(t)[t] = -36.5108269184238 + 0.472806269550534`x(t)`[t] + 0.878494577498195`y(t-1)`[t] + 0.267957282415803`y(t-2)`[t] + 0.164874664652139`y(t-3)`[t] -0.413165669629023`y(t-4)`[t] + e[t] |
| Multiple Linear Regression - Ordinary Least Squares | |||||
| Variable | Parameter | S.D. | T-STAT H0: parameter = 0 | 2-tail p-value | 1-tail p-value |
| (Intercept) | -36.5108269184238 | 51.098031 | -0.7145 | 0.479641 | 0.239821 |
| `x(t)` | 0.472806269550534 | 0.589968 | 0.8014 | 0.428302 | 0.214151 |
| `y(t-1)` | 0.878494577498195 | 0.161326 | 5.4455 | 4e-06 | 2e-06 |
| `y(t-2)` | 0.267957282415803 | 0.211502 | 1.2669 | 0.213547 | 0.106773 |
| `y(t-3)` | 0.164874664652139 | 0.21022 | 0.7843 | 0.438143 | 0.219072 |
| `y(t-4)` | -0.413165669629023 | 0.188817 | -2.1882 | 0.035421 | 0.017711 |
| Multiple Linear Regression - Regression Statistics | |
| Multiple R | 0.988327860167978 |
| R-squared | 0.976791959184214 |
| Adjusted R-squared | 0.97347652478196 |
| F-TEST (value) | 294.619600532529 |
| F-TEST (DF numerator) | 5 |
| F-TEST (DF denominator) | 35 |
| p-value | 0 |
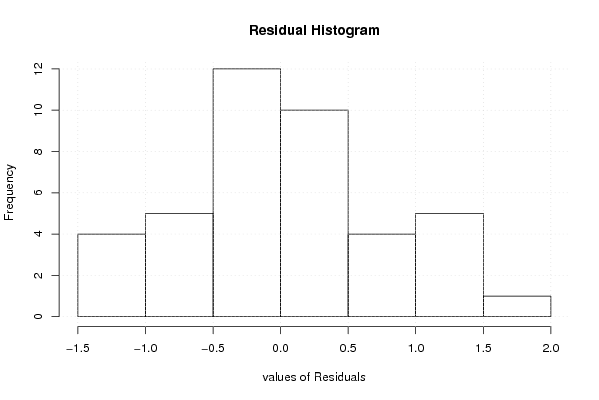
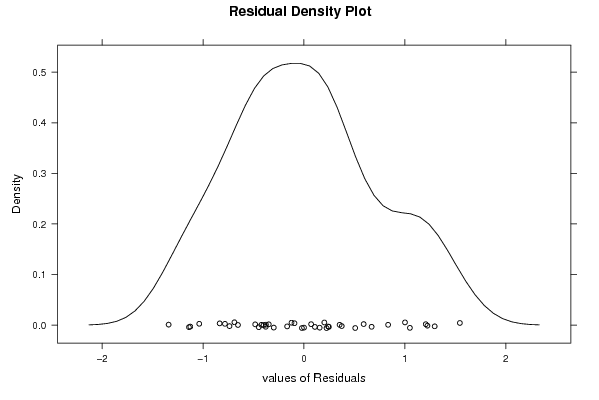
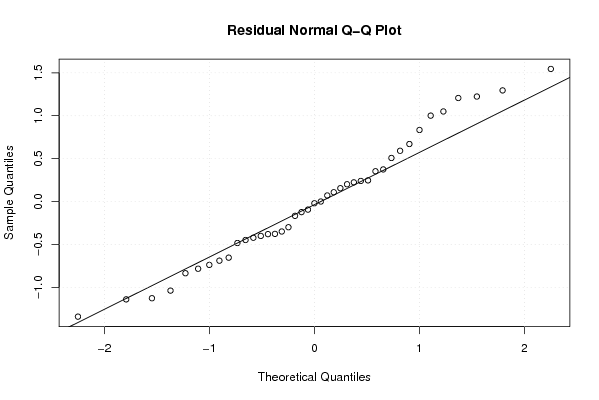
| Multiple Linear Regression - Residual Statistics | |
| Residual Standard Deviation | 0.772889638581292 |
| Sum Squared Residuals | 20.9075437699212 |
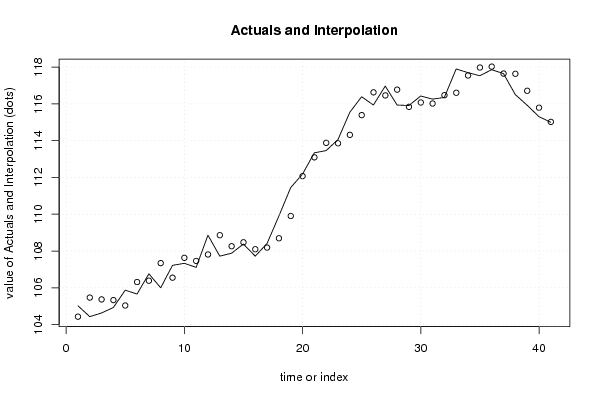
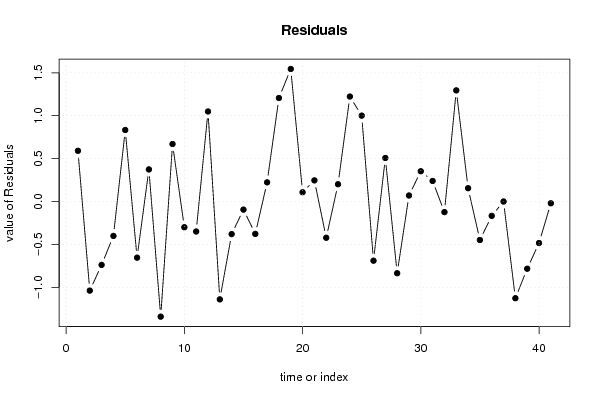
| Multiple Linear Regression - Actuals, Interpolation, and Residuals | |||
| Time or Index | Actuals | Interpolation Forecast | Residuals Prediction Error |
| 1 | 105.02 | 104.428510345164 | 0.591489654835985 |
| 2 | 104.43 | 105.467484536611 | -1.03748453661099 |
| 3 | 104.63 | 105.367861407690 | -0.737861407689779 |
| 4 | 104.93 | 105.330235750004 | -0.400235750003897 |
| 5 | 105.87 | 105.036028064552 | 0.833971935447653 |
| 6 | 105.66 | 106.313504084047 | -0.653504084047054 |
| 7 | 106.76 | 106.385553835277 | 0.374446164722843 |
| 8 | 106 | 107.340843513189 | -1.34084351318868 |
| 9 | 107.22 | 106.549669298615 | 0.67033070138529 |
| 10 | 107.33 | 107.629175317920 | -0.299175317919881 |
| 11 | 107.11 | 107.458746436178 | -0.348746436177889 |
| 12 | 108.86 | 107.810105929988 | 1.04989407001231 |
| 13 | 107.72 | 108.859331686988 | -1.13933168698845 |
| 14 | 107.88 | 108.259236651072 | -0.379236651072023 |
| 15 | 108.38 | 108.473751591977 | -0.0937515919773426 |
| 16 | 107.72 | 108.096883696009 | -0.376883696009296 |
| 17 | 108.41 | 108.186269227354 | 0.223730772646137 |
| 18 | 109.9 | 108.693374319660 | 1.20662568033983 |
| 19 | 111.45 | 109.904918090383 | 1.54508190961698 |
| 20 | 112.18 | 112.071206147652 | 0.108793852348092 |
| 21 | 113.34 | 113.093147977953 | 0.246852022046739 |
| 22 | 113.46 | 113.881556508741 | -0.421556508741203 |
| 23 | 114.06 | 113.858135088738 | 0.201864911262031 |
| 24 | 115.54 | 114.316486506685 | 1.22351349331492 |
| 25 | 116.39 | 115.388866574253 | 1.00113342574692 |
| 26 | 115.94 | 116.628789288493 | -0.68878928849279 |
| 27 | 116.97 | 116.462073583275 | 0.507926416724715 |
| 28 | 115.94 | 116.775000494915 | -0.835000494914678 |
| 29 | 115.91 | 115.838964230089 | 0.0710357699106803 |
| 30 | 116.43 | 116.076753292926 | 0.35324670707444 |
| 31 | 116.26 | 116.019983401657 | 0.240016598342837 |
| 32 | 116.35 | 116.473144074377 | -0.123144074376571 |
| 33 | 117.9 | 116.604785644049 | 1.29521435595131 |
| 34 | 117.7 | 117.544386857484 | 0.155613142516366 |
| 35 | 117.53 | 117.977844055381 | -0.447844055380741 |
| 36 | 117.86 | 118.026375779536 | -0.166375779535631 |
| 37 | 117.65 | 117.649353220894 | 0.000646779105519066 |
| 38 | 116.51 | 117.636268079925 | -1.12626807992506 |
| 39 | 115.93 | 116.712616160833 | -0.782616160832944 |
| 40 | 115.31 | 115.792842531113 | -0.482842531112532 |
| 41 | 115 | 115.019936718354 | -0.0199367183541721 |
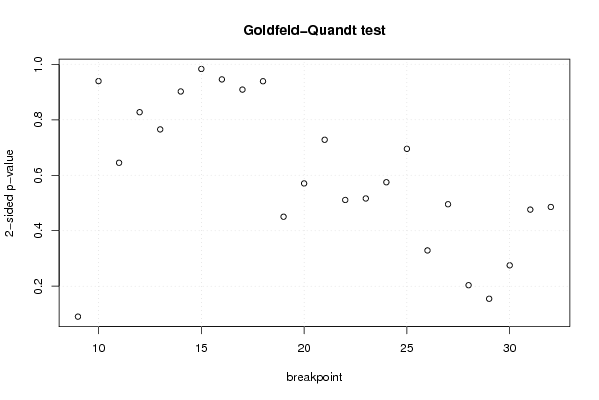
| Goldfeld-Quandt test for Heteroskedasticity | |||
| p-values | Alternative Hypothesis | ||
| breakpoint index | greater | 2-sided | less |
| 9 | 0.0451356385640813 | 0.0902712771281626 | 0.954864361435919 |
| 10 | 0.469658800596047 | 0.939317601192095 | 0.530341199403953 |
| 11 | 0.322464364694623 | 0.644928729389246 | 0.677535635305377 |
| 12 | 0.586354081304861 | 0.827291837390278 | 0.413645918695139 |
| 13 | 0.617367253407676 | 0.765265493184648 | 0.382632746592324 |
| 14 | 0.549024418588971 | 0.901951162822058 | 0.450975581411029 |
| 15 | 0.491586015042808 | 0.983172030085615 | 0.508413984957192 |
| 16 | 0.52726990914329 | 0.94546018171342 | 0.47273009085671 |
| 17 | 0.454372253413406 | 0.908744506826811 | 0.545627746586594 |
| 18 | 0.530564460671435 | 0.93887107865713 | 0.469435539328565 |
| 19 | 0.774769323378153 | 0.450461353243694 | 0.225230676621847 |
| 20 | 0.714751562752236 | 0.570496874495529 | 0.285248437247764 |
| 21 | 0.636052677801393 | 0.727894644397214 | 0.363947322198607 |
| 22 | 0.744564310449359 | 0.510871379101283 | 0.255435689550641 |
| 23 | 0.741856886082402 | 0.516286227835196 | 0.258143113917598 |
| 24 | 0.712630855883681 | 0.574738288232638 | 0.287369144116319 |
| 25 | 0.652447153598367 | 0.695105692803266 | 0.347552846401633 |
| 26 | 0.835529227657114 | 0.328941544685773 | 0.164470772342886 |
| 27 | 0.752259579220707 | 0.495480841558585 | 0.247740420779293 |
| 28 | 0.898193462986668 | 0.203613074026664 | 0.101806537013332 |
| 29 | 0.92261473484101 | 0.154770530317978 | 0.077385265158989 |
| 30 | 0.862340262045868 | 0.275319475908263 | 0.137659737954132 |
| 31 | 0.761940899738316 | 0.476118200523367 | 0.238059100261684 |
| 32 | 0.757208981921663 | 0.485582036156673 | 0.242791018078337 |
| Meta Analysis of Goldfeld-Quandt test for Heteroskedasticity | |||
| Description | # significant tests | % significant tests | OK/NOK |
| 1% type I error level | 0 | 0 | OK |
| 5% type I error level | 0 | 0 | OK |
| 10% type I error level | 1 | 0.0416666666666667 | OK |