| Multiple Linear Regression - Estimated Regression Equation |
| y(t)[t] = + 3.23484343028908 + 0.00980623397008176`x(t)`[t] + 1.05967389184518`y(t-1)`[t] -0.078236397966839`y(t-2)`[t] -0.259322390600045`y(t-3)`[t] + 0.235745370015547`y(t-4)`[t] + e[t] |
| Multiple Linear Regression - Ordinary Least Squares | |||||
| Variable | Parameter | S.D. | T-STAT H0: parameter = 0 | 2-tail p-value | 1-tail p-value |
| (Intercept) | 3.23484343028908 | 5.350932 | 0.6045 | 0.549385 | 0.274693 |
| `x(t)` | 0.00980623397008176 | 0.00935 | 1.0488 | 0.301438 | 0.150719 |
| `y(t-1)` | 1.05967389184518 | 0.166392 | 6.3685 | 0 | 0 |
| `y(t-2)` | -0.078236397966839 | 0.241364 | -0.3241 | 0.747759 | 0.37388 |
| `y(t-3)` | -0.259322390600045 | 0.242875 | -1.0677 | 0.292957 | 0.146479 |
| `y(t-4)` | 0.235745370015547 | 0.167281 | 1.4093 | 0.167576 | 0.083788 |
| Multiple Linear Regression - Regression Statistics | |
| Multiple R | 0.987945997772003 |
| R-squared | 0.976037294513718 |
| Adjusted R-squared | 0.97261405087282 |
| F-TEST (value) | 285.120603994712 |
| F-TEST (DF numerator) | 5 |
| F-TEST (DF denominator) | 35 |
| p-value | 0 |
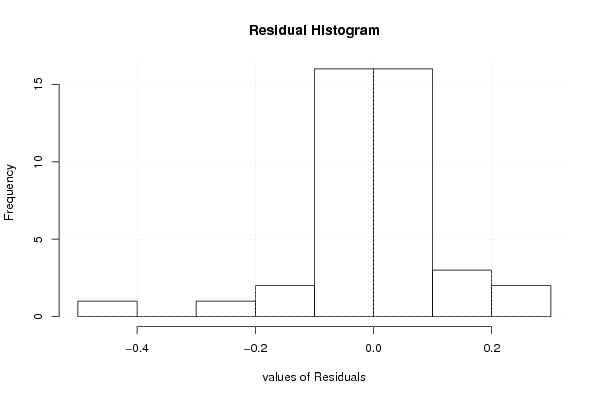
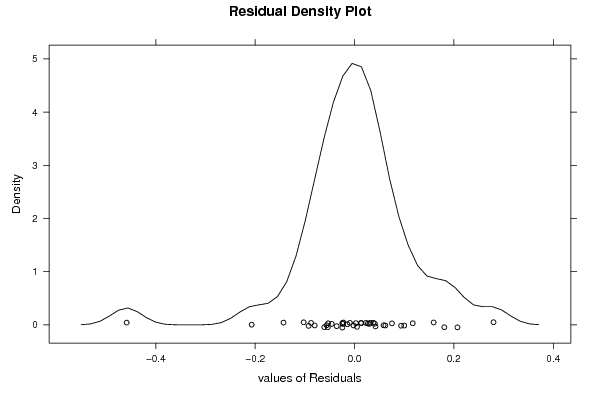
| Multiple Linear Regression - Residual Statistics | |
| Residual Standard Deviation | 0.126325888335065 |
| Sum Squared Residuals | 0.558538052227512 |
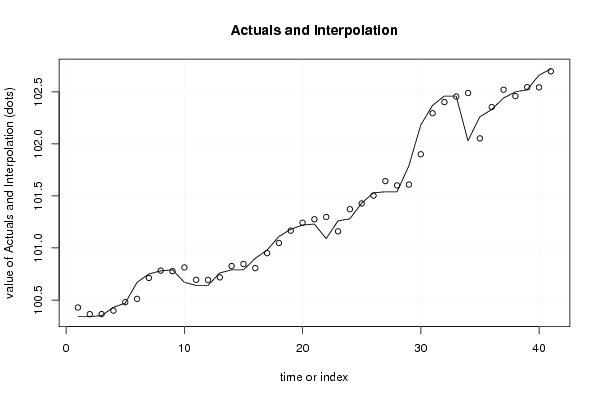
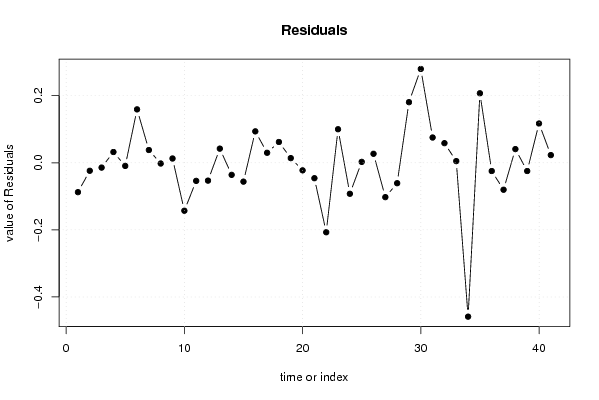
| Multiple Linear Regression - Actuals, Interpolation, and Residuals | |||
| Time or Index | Actuals | Interpolation Forecast | Residuals Prediction Error |
| 1 | 100.34 | 100.427597208559 | -0.0875972085586901 |
| 2 | 100.34 | 100.363887520079 | -0.0238875200790140 |
| 3 | 100.35 | 100.364338368754 | -0.0143383687535358 |
| 4 | 100.43 | 100.397915458493 | 0.0320845415065422 |
| 5 | 100.47 | 100.479337597293 | -0.009337597292526 |
| 6 | 100.67 | 100.510813108089 | 0.159186891910742 |
| 7 | 100.75 | 100.712016950359 | 0.0379830496411366 |
| 8 | 100.78 | 100.782177578273 | -0.00217757827309182 |
| 9 | 100.79 | 100.777237825315 | 0.0127621746847935 |
| 10 | 100.67 | 100.812969440786 | -0.142969440786479 |
| 11 | 100.64 | 100.693948796195 | -0.0539487961952083 |
| 12 | 100.64 | 100.693186993838 | -0.0531869938379806 |
| 13 | 100.76 | 100.717831119623 | 0.0421688803767487 |
| 14 | 100.79 | 100.826051211396 | -0.0360512113960248 |
| 15 | 100.79 | 100.84628381628 | -0.0562838162799347 |
| 16 | 100.9 | 100.806345923049 | 0.0936540769513304 |
| 17 | 100.98 | 100.950186125275 | 0.0298138747251378 |
| 18 | 101.11 | 101.048037682562 | 0.0619623174379843 |
| 19 | 101.18 | 101.166210576352 | 0.0137894236478478 |
| 20 | 101.22 | 101.242561767298 | -0.0225617672975086 |
| 21 | 101.23 | 101.275995125342 | -0.0459951253421565 |
| 22 | 101.09 | 101.297133487178 | -0.207133487178366 |
| 23 | 101.26 | 101.160009799000 | 0.099990201000491 |
| 24 | 101.28 | 101.372457273499 | -0.0924572734988925 |
| 25 | 101.43 | 101.427348450940 | 0.00265154905984417 |
| 26 | 101.53 | 101.503232843267 | 0.026767156733113 |
| 27 | 101.54 | 101.642455458836 | -0.102455458836195 |
| 28 | 101.54 | 101.600944685779 | -0.060944685779087 |
| 29 | 101.79 | 101.609297701223 | 0.180702298777354 |
| 30 | 102.18 | 101.900296728944 | 0.279703271056065 |
| 31 | 102.37 | 102.294700841197 | 0.0752991588029078 |
| 32 | 102.46 | 102.401578648848 | 0.0584213511520858 |
| 33 | 102.46 | 102.455084656324 | 0.00491534367623404 |
| 34 | 102.03 | 102.488751573805 | -0.458751573804783 |
| 35 | 102.26 | 102.052877345685 | 0.207122654314603 |
| 36 | 102.33 | 102.354697132447 | -0.0246971324470634 |
| 37 | 102.44 | 102.520329252168 | -0.0803292521681463 |
| 38 | 102.5 | 102.459223066743 | 0.0407769332571525 |
| 39 | 102.52 | 102.544578748536 | -0.0245787485361407 |
| 40 | 102.66 | 102.542974890369 | 0.117025109631340 |
| 41 | 102.72 | 102.697097222003 | 0.022902777997371 |
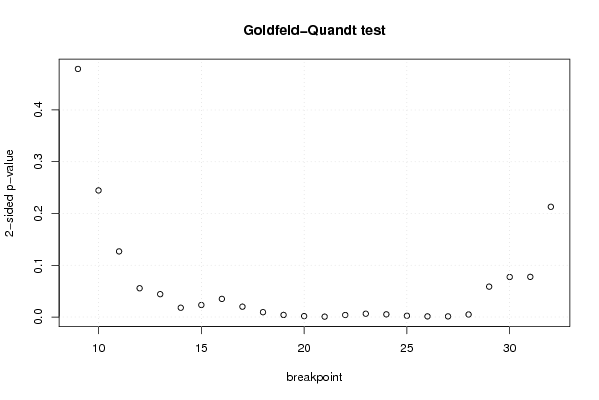
| Goldfeld-Quandt test for Heteroskedasticity | |||
| p-values | Alternative Hypothesis | ||
| breakpoint index | greater | 2-sided | less |
| 9 | 0.239593239200557 | 0.479186478401115 | 0.760406760799442 |
| 10 | 0.122281369387027 | 0.244562738774054 | 0.877718630612973 |
| 11 | 0.0634053601452349 | 0.126810720290470 | 0.936594639854765 |
| 12 | 0.0278108972213377 | 0.0556217944426755 | 0.972189102778662 |
| 13 | 0.0220840982907650 | 0.0441681965815301 | 0.977915901709235 |
| 14 | 0.00898967159887451 | 0.0179793431977490 | 0.991010328401125 |
| 15 | 0.0116383329203802 | 0.0232766658407604 | 0.98836166707962 |
| 16 | 0.0175189356894709 | 0.0350378713789418 | 0.98248106431053 |
| 17 | 0.0100057060460361 | 0.0200114120920721 | 0.989994293953964 |
| 18 | 0.00471663820397071 | 0.00943327640794142 | 0.99528336179603 |
| 19 | 0.00203906894972595 | 0.00407813789945191 | 0.997960931050274 |
| 20 | 0.000915443151555947 | 0.00183088630311189 | 0.999084556848444 |
| 21 | 0.000385134081331131 | 0.000770268162662261 | 0.999614865918669 |
| 22 | 0.00195855422007866 | 0.00391710844015732 | 0.998041445779921 |
| 23 | 0.00320002758039618 | 0.00640005516079237 | 0.996799972419604 |
| 24 | 0.0026284648980084 | 0.0052569297960168 | 0.997371535101992 |
| 25 | 0.00125122328609191 | 0.00250244657218381 | 0.998748776713908 |
| 26 | 0.000674833794499011 | 0.00134966758899802 | 0.9993251662055 |
| 27 | 0.000661878575713988 | 0.00132375715142798 | 0.999338121424286 |
| 28 | 0.00247250374208703 | 0.00494500748417406 | 0.997527496257913 |
| 29 | 0.0293638156456113 | 0.0587276312912227 | 0.970636184354389 |
| 30 | 0.0386633551914963 | 0.0773267103829925 | 0.961336644808504 |
| 31 | 0.0388013029380512 | 0.0776026058761023 | 0.961198697061949 |
| 32 | 0.106479598587776 | 0.212959197175553 | 0.893520401412224 |
| Meta Analysis of Goldfeld-Quandt test for Heteroskedasticity | |||
| Description | # significant tests | % significant tests | OK/NOK |
| 1% type I error level | 11 | 0.458333333333333 | NOK |
| 5% type I error level | 16 | 0.666666666666667 | NOK |
| 10% type I error level | 20 | 0.833333333333333 | NOK |