| Multiple Linear Regression - Estimated Regression Equation |
| Y[t] = + 85.7644343849996 + 0.234218267557403X[t] + 0.631597084370433M1[t] + 4.09069715906612M2[t] + 5.61957925812608M3[t] + 8.78867933282185M4[t] + 13.8369594333415M5[t] + 12.9039122784857M6[t] + 16.3271361953193M7[t] + 14.3765491089529M8[t] + 10.5264576830592M9[t] + 1.47643700324979M10[t] + 3.44471695780859M11[t] + 0.191932283694180t + e[t] |
| Multiple Linear Regression - Ordinary Least Squares | |||||
| Variable | Parameter | S.D. | T-STAT H0: parameter = 0 | 2-tail p-value | 1-tail p-value |
| (Intercept) | 85.7644343849996 | 19.643654 | 4.366 | 7.1e-05 | 3.6e-05 |
| X | 0.234218267557403 | 0.187796 | 1.2472 | 0.218639 | 0.10932 |
| M1 | 0.631597084370433 | 3.416654 | 0.1849 | 0.854153 | 0.427076 |
| M2 | 4.09069715906612 | 3.795732 | 1.0777 | 0.286783 | 0.143391 |
| M3 | 5.61957925812608 | 3.193311 | 1.7598 | 0.085091 | 0.042546 |
| M4 | 8.78867933282185 | 3.343361 | 2.6287 | 0.011613 | 0.005807 |
| M5 | 13.8369594333415 | 3.375053 | 4.0998 | 0.000167 | 8.3e-05 |
| M6 | 12.9039122784857 | 3.194649 | 4.0392 | 0.000202 | 0.000101 |
| M7 | 16.3271361953193 | 3.324165 | 4.9117 | 1.2e-05 | 6e-06 |
| M8 | 14.3765491089529 | 3.210468 | 4.478 | 4.9e-05 | 2.5e-05 |
| M9 | 10.5264576830592 | 3.262372 | 3.2266 | 0.00231 | 0.001155 |
| M10 | 1.47643700324979 | 3.535892 | 0.4176 | 0.678214 | 0.339107 |
| M11 | 3.44471695780859 | 3.175797 | 1.0847 | 0.283717 | 0.141858 |
| t | 0.191932283694180 | 0.07491 | 2.5622 | 0.013742 | 0.006871 |
| Multiple Linear Regression - Regression Statistics | |
| Multiple R | 0.859456865028675 |
| R-squared | 0.738666102844917 |
| Adjusted R-squared | 0.66481087104022 |
| F-TEST (value) | 10.0015406464128 |
| F-TEST (DF numerator) | 13 |
| F-TEST (DF denominator) | 46 |
| p-value | 1.77725079097968e-09 |
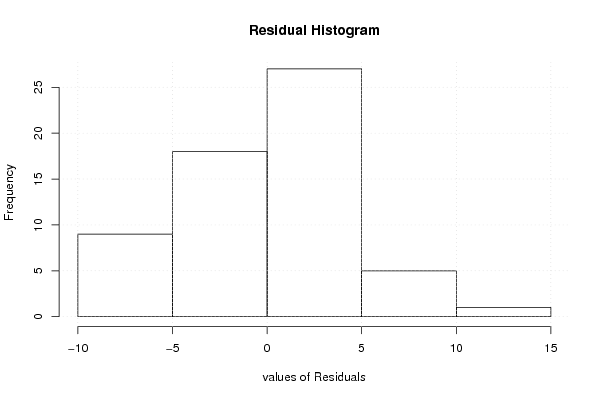
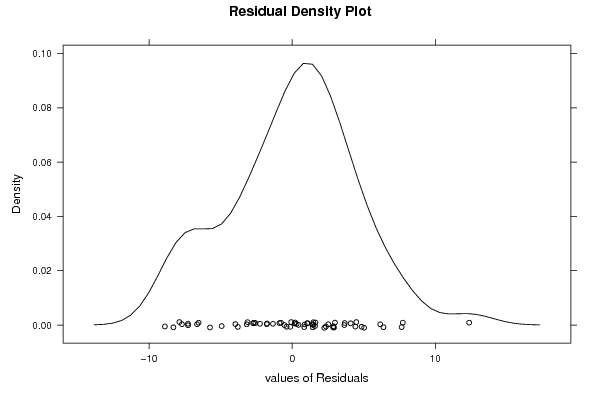
| Multiple Linear Regression - Residual Statistics | |
| Residual Standard Deviation | 5.01286005806824 |
| Sum Squared Residuals | 1155.92323424169 |
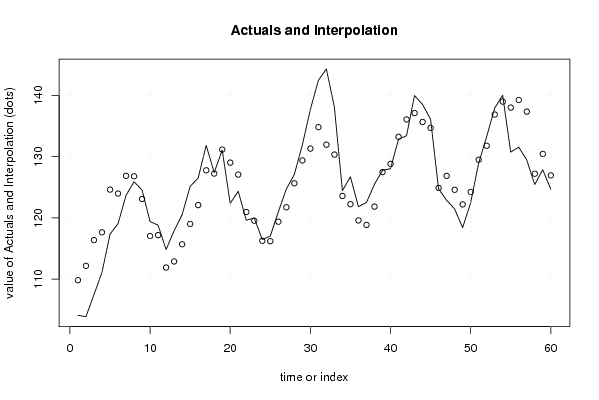
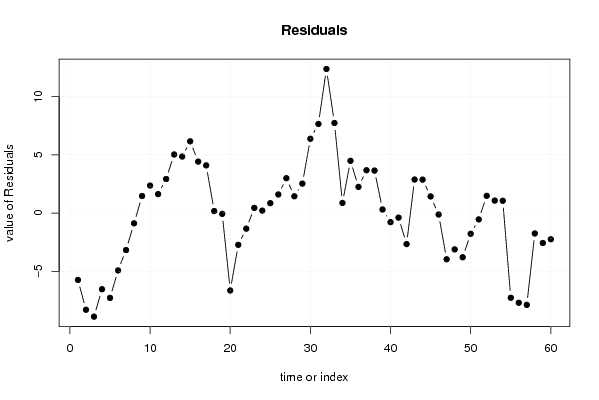
| Multiple Linear Regression - Actuals, Interpolation, and Residuals | |||
| Time or Index | Actuals | Interpolation Forecast | Residuals Prediction Error |
| 1 | 104.08 | 109.822415894758 | -5.7424158947582 |
| 2 | 103.86 | 112.161825954827 | -8.301825954827 |
| 3 | 107.47 | 116.365353973690 | -8.89535397368965 |
| 4 | 111.1 | 117.641843750819 | -6.5418437508187 |
| 5 | 117.33 | 124.615271314957 | -7.28527131495727 |
| 6 | 119.04 | 123.967843750819 | -4.92784375081868 |
| 7 | 123.68 | 126.856923321918 | -3.17692332191848 |
| 8 | 125.9 | 126.784640045660 | -0.884640045659552 |
| 9 | 124.54 | 123.079637249949 | 1.46036275005146 |
| 10 | 119.39 | 117.032168064522 | 2.35783193547781 |
| 11 | 118.8 | 117.178103201781 | 1.62189679821851 |
| 12 | 114.81 | 111.887619599918 | 2.92238040008234 |
| 13 | 117.9 | 112.875101755272 | 5.02489824472755 |
| 14 | 120.53 | 115.682948350456 | 4.84705164954433 |
| 15 | 125.15 | 118.99644695260 | 6.15355304739985 |
| 16 | 126.49 | 122.076417389921 | 4.41358261007877 |
| 17 | 131.85 | 127.761644482494 | 4.08835551750593 |
| 18 | 127.4 | 127.231326052134 | 0.168673947865794 |
| 19 | 131.08 | 131.150966000487 | -0.0709660004865453 |
| 20 | 122.37 | 129.017561969722 | -6.6475619697225 |
| 21 | 124.34 | 127.069196180692 | -2.72919618069201 |
| 22 | 119.61 | 120.951461514998 | -1.34146151499843 |
| 23 | 119.97 | 119.528134259623 | 0.441865740376879 |
| 24 | 116.46 | 116.251927758753 | 0.208072241247019 |
| 25 | 117.03 | 116.185427710099 | 0.84457228990055 |
| 26 | 120.96 | 119.368023533375 | 1.59197646662548 |
| 27 | 124.71 | 121.721227238534 | 2.98877276146635 |
| 28 | 127.08 | 125.644383439061 | 1.43561656093864 |
| 29 | 131.91 | 129.385598910908 | 2.52440108909225 |
| 30 | 137.69 | 131.314572289901 | 6.37542771009937 |
| 31 | 142.46 | 134.812619356650 | 7.64738064335036 |
| 32 | 144.32 | 131.953138696458 | 12.3668613035424 |
| 33 | 138.06 | 130.332678482008 | 7.72732151799248 |
| 34 | 124.45 | 123.582554493909 | 0.867445506091054 |
| 35 | 126.71 | 122.229492718801 | 4.48050728119913 |
| 36 | 121.83 | 119.585675540336 | 2.24432445966429 |
| 37 | 122.51 | 118.839942515766 | 3.67005748423429 |
| 38 | 125.48 | 121.835163724995 | 3.64483627500515 |
| 39 | 127.77 | 127.467423175958 | 0.302576824042367 |
| 40 | 128.03 | 128.814178433354 | -0.78417843335391 |
| 41 | 132.84 | 133.234626881117 | -0.39462688111677 |
| 42 | 133.41 | 136.077051503584 | -2.66705150358353 |
| 43 | 139.99 | 137.115806760980 | 2.87419323902021 |
| 44 | 138.53 | 135.661635706132 | 2.86836429386778 |
| 45 | 136.12 | 134.696986640843 | 1.42301335915717 |
| 46 | 124.75 | 124.878603347742 | -0.128603347742271 |
| 47 | 122.88 | 126.851440971949 | -3.97144097194932 |
| 48 | 121.46 | 124.582373021576 | -3.12237302157601 |
| 49 | 118.4 | 122.197112124104 | -3.79711212410418 |
| 50 | 122.45 | 124.232038436348 | -1.78203843634797 |
| 51 | 128.94 | 129.489548659219 | -0.549548659218909 |
| 52 | 133.25 | 131.773176986845 | 1.47682301315520 |
| 53 | 137.94 | 136.872858410524 | 1.06714158947587 |
| 54 | 140.04 | 138.989206403563 | 1.05079359643705 |
| 55 | 130.74 | 138.013684559966 | -7.27368455996554 |
| 56 | 131.55 | 139.253023582028 | -7.70302358202809 |
| 57 | 129.47 | 137.351501446509 | -7.8815014465091 |
| 58 | 125.45 | 127.205212578828 | -1.75521257882816 |
| 59 | 127.87 | 130.442828847845 | -2.57282884784519 |
| 60 | 124.68 | 126.932404079418 | -2.25240407941764 |
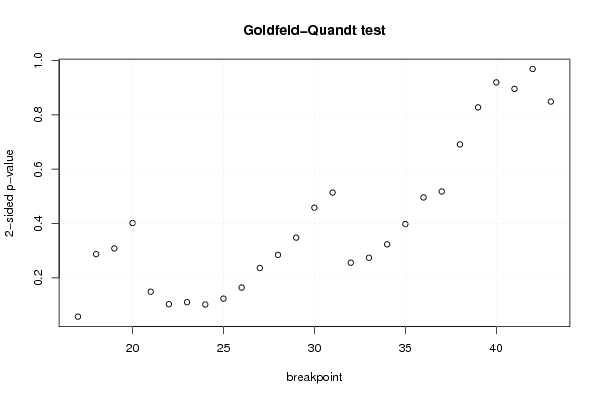
| Goldfeld-Quandt test for Heteroskedasticity | |||
| p-values | Alternative Hypothesis | ||
| breakpoint index | greater | 2-sided | less |
| 17 | 0.0286176913528057 | 0.0572353827056114 | 0.971382308647194 |
| 18 | 0.143652281831704 | 0.287304563663407 | 0.856347718168296 |
| 19 | 0.154146999046656 | 0.308293998093312 | 0.845853000953344 |
| 20 | 0.79898903476068 | 0.402021930478642 | 0.201010965239321 |
| 21 | 0.925493293735853 | 0.149013412528293 | 0.0745067062641466 |
| 22 | 0.94845883218564 | 0.103082335628721 | 0.0515411678143605 |
| 23 | 0.944806970949244 | 0.110386058101512 | 0.0551930290507562 |
| 24 | 0.948935109565474 | 0.102129780869051 | 0.0510648904345256 |
| 25 | 0.93820165698407 | 0.123596686031858 | 0.0617983430159292 |
| 26 | 0.917942369423405 | 0.164115261153189 | 0.0820576305765947 |
| 27 | 0.881916710524679 | 0.236166578950642 | 0.118083289475321 |
| 28 | 0.857638413040286 | 0.284723173919427 | 0.142361586959714 |
| 29 | 0.825905031802106 | 0.348189936395787 | 0.174094968197894 |
| 30 | 0.770787783438673 | 0.458424433122654 | 0.229212216561327 |
| 31 | 0.742978337415059 | 0.514043325169882 | 0.257021662584941 |
| 32 | 0.872090426759332 | 0.255819146481336 | 0.127909573240668 |
| 33 | 0.862933018416606 | 0.274133963166788 | 0.137066981583394 |
| 34 | 0.838277266284344 | 0.323445467431313 | 0.161722733715656 |
| 35 | 0.80097266652139 | 0.398054666957221 | 0.199027333478610 |
| 36 | 0.751975877310892 | 0.496048245378216 | 0.248024122689108 |
| 37 | 0.740974983089632 | 0.518050033820736 | 0.259025016910368 |
| 38 | 0.654380516014774 | 0.691238967970452 | 0.345619483985226 |
| 39 | 0.586117176435559 | 0.827765647128882 | 0.413882823564441 |
| 40 | 0.540122091502696 | 0.919755816994608 | 0.459877908497304 |
| 41 | 0.447931329798714 | 0.895862659597428 | 0.552068670201286 |
| 42 | 0.484588646596725 | 0.96917729319345 | 0.515411353403275 |
| 43 | 0.42447662042479 | 0.84895324084958 | 0.57552337957521 |
| Meta Analysis of Goldfeld-Quandt test for Heteroskedasticity | |||
| Description | # significant tests | % significant tests | OK/NOK |
| 1% type I error level | 0 | 0 | OK |
| 5% type I error level | 0 | 0 | OK |
| 10% type I error level | 1 | 0.0370370370370370 | OK |