| Multiple Linear Regression - Estimated Regression Equation |
| inv[t] = -68.9708525393686 + 1.58049859530267cons[t] + e[t] |
| Multiple Linear Regression - Ordinary Least Squares | |||||
| Variable | Parameter | S.D. | T-STAT H0: parameter = 0 | 2-tail p-value | 1-tail p-value |
| (Intercept) | -68.9708525393686 | 22.08574 | -3.1229 | 0.002793 | 0.001397 |
| cons | 1.58049859530267 | 0.1876 | 8.4248 | 0 | 0 |
| Multiple Linear Regression - Regression Statistics | |
| Multiple R | 0.741829610929678 |
| R-squared | 0.550311171652077 |
| Adjusted R-squared | 0.542557915990906 |
| F-TEST (value) | 70.978076269054 |
| F-TEST (DF numerator) | 1 |
| F-TEST (DF denominator) | 58 |
| p-value | 1.19335652470909e-11 |
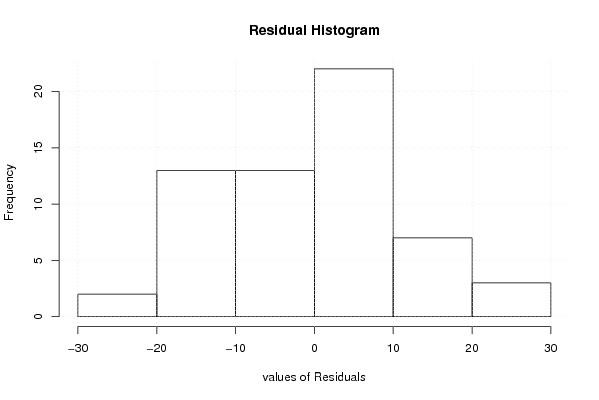
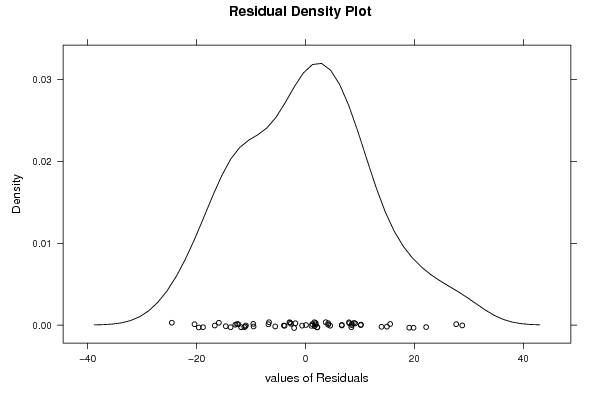
| Multiple Linear Regression - Residual Statistics | |
| Residual Standard Deviation | 12.0632206961269 |
| Sum Squared Residuals | 8440.23502668097 |
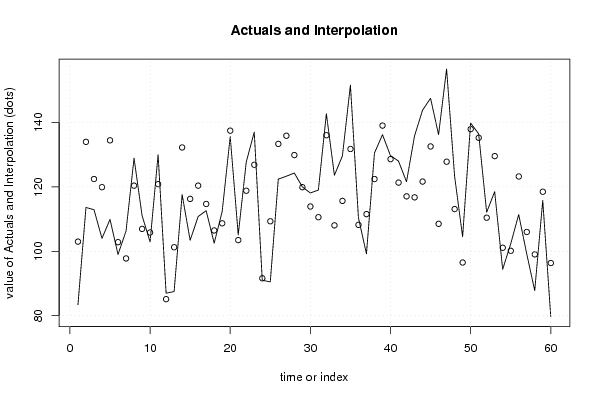
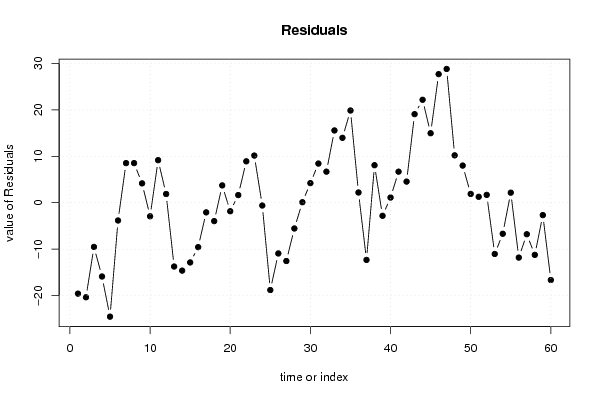
| Multiple Linear Regression - Actuals, Interpolation, and Residuals | |||
| Time or Index | Actuals | Interpolation Forecast | Residuals Prediction Error |
| 1 | 83.4 | 102.987394629562 | -19.5873946295617 |
| 2 | 113.6 | 133.965167097494 | -20.3651670974937 |
| 3 | 112.9 | 122.427527351784 | -9.52752735178425 |
| 4 | 104 | 119.8987295993 | -15.8987295993 |
| 5 | 109.9 | 134.439316676085 | -24.5393166760845 |
| 6 | 99 | 102.829344770031 | -3.82934477003122 |
| 7 | 106.3 | 97.7717492650627 | 8.5282507349373 |
| 8 | 128.9 | 120.372879177891 | 8.52712082210921 |
| 9 | 111.1 | 106.938641117818 | 4.16135888218185 |
| 10 | 102.9 | 105.832292101106 | -2.93229210110627 |
| 11 | 130 | 120.847028756482 | 9.1529712435184 |
| 12 | 87 | 85.1277605026414 | 1.87223949735863 |
| 13 | 87.5 | 101.248846174729 | -13.7488461747286 |
| 14 | 117.6 | 132.226618642661 | -14.6266186426608 |
| 15 | 103.4 | 116.263582830104 | -12.8635828301039 |
| 16 | 110.8 | 120.372879177891 | -9.5728791778908 |
| 17 | 112.6 | 114.683084234801 | -2.08308423480122 |
| 18 | 102.5 | 106.464491539227 | -3.96449153922735 |
| 19 | 112.4 | 108.677189572651 | 3.72281042734892 |
| 20 | 135.6 | 137.442264007160 | -1.84226400715958 |
| 21 | 105.1 | 103.461544208152 | 1.63845579184772 |
| 22 | 127.7 | 118.792380582588 | 8.90761941741187 |
| 23 | 137 | 126.852923418632 | 10.1470765813683 |
| 24 | 91 | 91.6078047433823 | -0.607804743382288 |
| 25 | 90.5 | 109.309389010772 | -18.8093890107721 |
| 26 | 122.4 | 133.332967659373 | -10.9329676593727 |
| 27 | 123.3 | 135.861765411857 | -12.5617654118569 |
| 28 | 124.3 | 129.855870749707 | -5.55587074970679 |
| 29 | 120 | 119.8987295993 | 0.101270400699997 |
| 30 | 118.1 | 113.892834937150 | 4.20716506285011 |
| 31 | 119 | 110.573787887014 | 8.42621211298573 |
| 32 | 142.7 | 136.019815271387 | 6.68018472861282 |
| 33 | 123.6 | 108.04499013453 | 15.5550098654700 |
| 34 | 129.6 | 115.631383391983 | 13.9686166080172 |
| 35 | 151.6 | 131.75246906407 | 19.84753093593 |
| 36 | 110.4 | 108.203039994060 | 2.19696000593973 |
| 37 | 99.2 | 111.522087044196 | -12.3220870441959 |
| 38 | 130.5 | 122.427527351784 | 8.07247264821574 |
| 39 | 136.2 | 139.022762602462 | -2.82276260246225 |
| 40 | 129.7 | 128.591471873465 | 1.10852812653533 |
| 41 | 128 | 121.321178335072 | 6.67882166492759 |
| 42 | 121.6 | 117.053832127755 | 4.54616787224478 |
| 43 | 135.8 | 116.737732408695 | 19.0622675913053 |
| 44 | 143.8 | 121.637278054133 | 22.1627219458671 |
| 45 | 147.5 | 132.542718361721 | 14.9572816382787 |
| 46 | 136.2 | 108.519139713121 | 27.6808602868792 |
| 47 | 156.6 | 127.801222575813 | 28.7987774241867 |
| 48 | 123.3 | 113.102585639499 | 10.1974143605014 |
| 49 | 104.5 | 96.5073503888206 | 7.99264961117944 |
| 50 | 139.8 | 137.916413585750 | 1.88358641424962 |
| 51 | 136.5 | 135.229565973736 | 1.27043402626416 |
| 52 | 112.1 | 110.415738027484 | 1.68426197251598 |
| 53 | 118.5 | 129.539771030646 | -11.0397710306463 |
| 54 | 94.4 | 101.090796315198 | -6.69079631519827 |
| 55 | 102.3 | 100.142497158017 | 2.15750284198331 |
| 56 | 111.4 | 123.217776649436 | -11.8177766494356 |
| 57 | 99.2 | 105.990341960637 | -6.79034196063655 |
| 58 | 87.8 | 99.0361481413048 | -11.2361481413048 |
| 59 | 115.8 | 118.476280863528 | -2.6762808635276 |
| 60 | 79.7 | 96.3493005292903 | -16.6493005292903 |
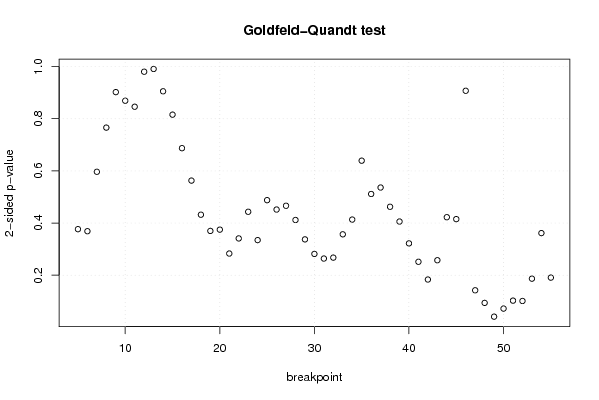
| Goldfeld-Quandt test for Heteroskedasticity | |||
| p-values | Alternative Hypothesis | ||
| breakpoint index | greater | 2-sided | less |
| 5 | 0.188313690313087 | 0.376627380626174 | 0.811686309686913 |
| 6 | 0.184392448024232 | 0.368784896048463 | 0.815607551975768 |
| 7 | 0.298298918311352 | 0.596597836622704 | 0.701701081688648 |
| 8 | 0.61703498135506 | 0.76593003728988 | 0.38296501864494 |
| 9 | 0.549007327853092 | 0.901985344293817 | 0.450992672146908 |
| 10 | 0.434505080052105 | 0.869010160104209 | 0.565494919947895 |
| 11 | 0.577013838606838 | 0.845972322786324 | 0.422986161393162 |
| 12 | 0.490087407882785 | 0.980174815765571 | 0.509912592117215 |
| 13 | 0.504575941228833 | 0.990848117542334 | 0.495424058771167 |
| 14 | 0.452594770956136 | 0.905189541912271 | 0.547405229043864 |
| 15 | 0.407792054075276 | 0.815584108150551 | 0.592207945924724 |
| 16 | 0.343572908754650 | 0.6871458175093 | 0.65642709124535 |
| 17 | 0.281402417394331 | 0.562804834788662 | 0.718597582605669 |
| 18 | 0.215985838509176 | 0.431971677018353 | 0.784014161490824 |
| 19 | 0.184934541811452 | 0.369869083622904 | 0.815065458188548 |
| 20 | 0.187396841429861 | 0.374793682859723 | 0.812603158570139 |
| 21 | 0.141578576824194 | 0.283157153648388 | 0.858421423175806 |
| 22 | 0.170583369828039 | 0.341166739656077 | 0.829416630171961 |
| 23 | 0.221624371582684 | 0.443248743165368 | 0.778375628417316 |
| 24 | 0.16731638327254 | 0.33463276654508 | 0.83268361672746 |
| 25 | 0.243883720113915 | 0.48776744022783 | 0.756116279886085 |
| 26 | 0.225894586381009 | 0.451789172762018 | 0.774105413618991 |
| 27 | 0.233136957214068 | 0.466273914428136 | 0.766863042785932 |
| 28 | 0.205886010590490 | 0.411772021180981 | 0.79411398940951 |
| 29 | 0.168719876383575 | 0.337439752767149 | 0.831280123616425 |
| 30 | 0.140855832363932 | 0.281711664727865 | 0.859144167636068 |
| 31 | 0.131949352348175 | 0.263898704696350 | 0.868050647651825 |
| 32 | 0.133762760075017 | 0.267525520150034 | 0.866237239924983 |
| 33 | 0.1784485415122 | 0.3568970830244 | 0.8215514584878 |
| 34 | 0.206690012199683 | 0.413380024399367 | 0.793309987800317 |
| 35 | 0.319560563285587 | 0.639121126571173 | 0.680439436714413 |
| 36 | 0.255730278997320 | 0.511460557994639 | 0.74426972100268 |
| 37 | 0.268112306419876 | 0.536224612839751 | 0.731887693580124 |
| 38 | 0.231216878011835 | 0.46243375602367 | 0.768783121988165 |
| 39 | 0.202912479944124 | 0.405824959888247 | 0.797087520055876 |
| 40 | 0.161025521708948 | 0.322051043417895 | 0.838974478291052 |
| 41 | 0.125789253198104 | 0.251578506396208 | 0.874210746801896 |
| 42 | 0.0917574670176308 | 0.183514934035262 | 0.90824253298237 |
| 43 | 0.128731793872939 | 0.257463587745877 | 0.871268206127061 |
| 44 | 0.211210727695389 | 0.422421455390778 | 0.788789272304611 |
| 45 | 0.207573117388364 | 0.415146234776728 | 0.792426882611636 |
| 46 | 0.546433774184764 | 0.907132451630473 | 0.453566225815236 |
| 47 | 0.928886240398431 | 0.142227519203138 | 0.071113759601569 |
| 48 | 0.952993142161838 | 0.0940137156763237 | 0.0470068578381618 |
| 49 | 0.9794010010082 | 0.0411979979835982 | 0.0205989989917991 |
| 50 | 0.963952278568594 | 0.0720954428628114 | 0.0360477214314057 |
| 51 | 0.948712436050982 | 0.102575127898035 | 0.0512875639490177 |
| 52 | 0.949352952866937 | 0.101294094266126 | 0.0506470471330632 |
| 53 | 0.906572350026486 | 0.186855299947027 | 0.0934276499735137 |
| 54 | 0.819259815123841 | 0.361480369752317 | 0.180740184876159 |
| 55 | 0.90458100982527 | 0.190837980349461 | 0.0954189901747304 |
| Meta Analysis of Goldfeld-Quandt test for Heteroskedasticity | |||
| Description | # significant tests | % significant tests | OK/NOK |
| 1% type I error level | 0 | 0 | OK |
| 5% type I error level | 1 | 0.0196078431372549 | OK |
| 10% type I error level | 3 | 0.0588235294117647 | OK |