| Multiple Linear Regression - Estimated Regression Equation |
| gk[t] = + 20.7561980198020 + 1.29384653465347cr[t] + 0.406803836633668M1[t] + 0.0099071782178209M2[t] -0.097489480198021M3[t] + 0.339863861386138M4[t] + 0.203967202970295M5[t] + 0.937320544554454M6[t] + 0.891423886138612M7[t] + 1.36577722772277M8[t] + 1.80963056930693M9[t] + 0.793983910891087M10[t] -0.0116627475247544M11[t] -0.153103341584158t + e[t] |
| Multiple Linear Regression - Ordinary Least Squares | |||||
| Variable | Parameter | S.D. | T-STAT H0: parameter = 0 | 2-tail p-value | 1-tail p-value |
| (Intercept) | 20.7561980198020 | 0.713346 | 29.097 | 0 | 0 |
| cr | 1.29384653465347 | 0.467581 | 2.7671 | 0.009197 | 0.004599 |
| M1 | 0.406803836633668 | 0.681237 | 0.5972 | 0.55448 | 0.27724 |
| M2 | 0.0099071782178209 | 0.67898 | 0.0146 | 0.988446 | 0.494223 |
| M3 | -0.097489480198021 | 0.677067 | -0.144 | 0.886386 | 0.443193 |
| M4 | 0.339863861386138 | 0.675499 | 0.5031 | 0.618215 | 0.309107 |
| M5 | 0.203967202970295 | 0.674281 | 0.3025 | 0.764173 | 0.382086 |
| M6 | 0.937320544554454 | 0.673413 | 1.3919 | 0.173265 | 0.086632 |
| M7 | 0.891423886138612 | 0.672897 | 1.3248 | 0.194353 | 0.097177 |
| M8 | 1.36577722772277 | 0.672734 | 2.0302 | 0.050461 | 0.025231 |
| M9 | 1.80963056930693 | 0.672923 | 2.6892 | 0.011143 | 0.005572 |
| M10 | 0.793983910891087 | 0.673466 | 1.179 | 0.246848 | 0.123424 |
| M11 | -0.0116627475247544 | 0.67436 | -0.0173 | 0.986306 | 0.493153 |
| t | -0.153103341584158 | 0.015411 | -9.9345 | 0 | 0 |
| Multiple Linear Regression - Regression Statistics | |
| Multiple R | 0.960538306463213 |
| R-squared | 0.922633838183218 |
| Adjusted R-squared | 0.892156259285697 |
| F-TEST (value) | 30.2725436717115 |
| F-TEST (DF numerator) | 13 |
| F-TEST (DF denominator) | 33 |
| p-value | 1.37667655053519e-14 |
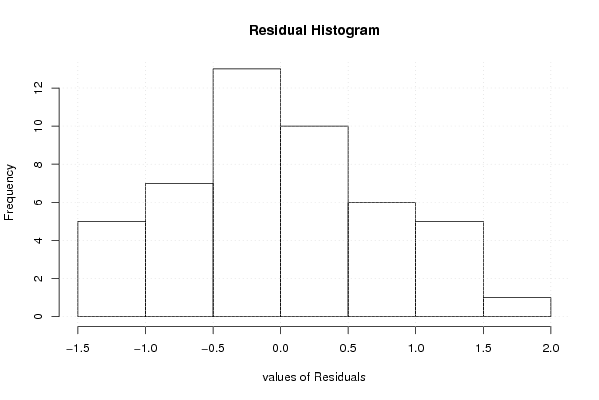
| Multiple Linear Regression - Residual Statistics | |
| Residual Standard Deviation | 0.880227216885127 |
| Sum Squared Residuals | 25.5683984603961 |
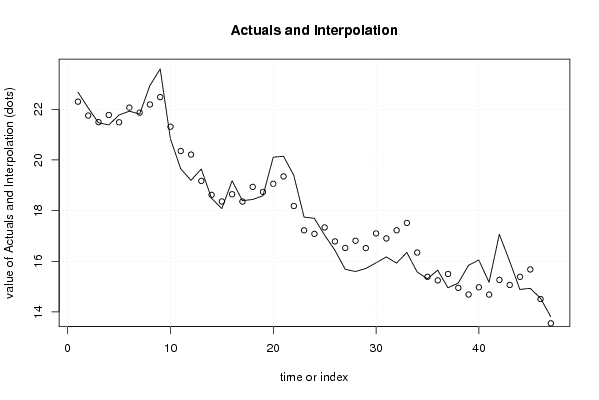
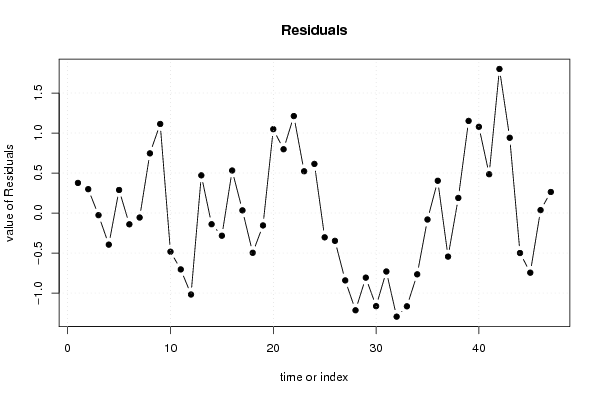
| Multiple Linear Regression - Actuals, Interpolation, and Residuals | |||
| Time or Index | Actuals | Interpolation Forecast | Residuals Prediction Error |
| 1 | 22.68 | 22.3037450495049 | 0.376254950495066 |
| 2 | 22.052 | 21.7537450495049 | 0.298254950495049 |
| 3 | 21.467 | 21.4932450495050 | -0.0262450495049532 |
| 4 | 21.383 | 21.7774950495050 | -0.394495049504953 |
| 5 | 21.777 | 21.4884950495050 | 0.28850495049505 |
| 6 | 21.928 | 22.0687450495050 | -0.140745049504952 |
| 7 | 21.814 | 21.8697450495049 | -0.0557450495049507 |
| 8 | 22.937 | 22.1909950495050 | 0.74600495049505 |
| 9 | 23.595 | 22.4817450495050 | 1.11325495049505 |
| 10 | 20.83 | 21.3129950495050 | -0.482995049504953 |
| 11 | 19.65 | 20.3542450495050 | -0.704245049504954 |
| 12 | 19.195 | 20.2128044554455 | -1.01780445544555 |
| 13 | 19.644 | 19.1726584158416 | 0.471341584158410 |
| 14 | 18.483 | 18.6226584158416 | -0.139658415841585 |
| 15 | 18.079 | 18.3621584158416 | -0.283158415841583 |
| 16 | 19.178 | 18.6464084158416 | 0.531591584158417 |
| 17 | 18.391 | 18.3574084158416 | 0.0335915841584155 |
| 18 | 18.441 | 18.9376584158416 | -0.496658415841584 |
| 19 | 18.584 | 18.7386584158416 | -0.154658415841584 |
| 20 | 20.108 | 19.0599084158416 | 1.04809158415842 |
| 21 | 20.148 | 19.3506584158416 | 0.797341584158417 |
| 22 | 19.394 | 18.1819084158416 | 1.21209158415842 |
| 23 | 17.745 | 17.2231584158416 | 0.521841584158418 |
| 24 | 17.696 | 17.0817178217822 | 0.614282178217822 |
| 25 | 17.032 | 17.3354183168317 | -0.303418316831689 |
| 26 | 16.438 | 16.7854183168317 | -0.347418316831684 |
| 27 | 15.683 | 16.5249183168317 | -0.841918316831683 |
| 28 | 15.594 | 16.8091683168317 | -1.21516831683168 |
| 29 | 15.713 | 16.5201683168317 | -0.807168316831683 |
| 30 | 15.937 | 17.1004183168317 | -1.16341831683168 |
| 31 | 16.171 | 16.9014183168317 | -0.730418316831683 |
| 32 | 15.928 | 17.2226683168317 | -1.29466831683168 |
| 33 | 16.348 | 17.5134183168317 | -1.16541831683168 |
| 34 | 15.579 | 16.3446683168317 | -0.765668316831681 |
| 35 | 15.305 | 15.3859183168317 | -0.0809183168316815 |
| 36 | 15.648 | 15.2444777227723 | 0.403522277227722 |
| 37 | 14.954 | 15.4981782178218 | -0.544178217821787 |
| 38 | 15.137 | 14.9481782178218 | 0.188821782178219 |
| 39 | 15.839 | 14.6876782178218 | 1.15132178217822 |
| 40 | 16.05 | 14.9719282178218 | 1.07807178217822 |
| 41 | 15.168 | 14.6829282178218 | 0.485071782178218 |
| 42 | 17.064 | 15.2631782178218 | 1.80082178217822 |
| 43 | 16.005 | 15.0641782178218 | 0.940821782178217 |
| 44 | 14.886 | 15.3854282178218 | -0.499428217821783 |
| 45 | 14.931 | 15.6761782178218 | -0.745178217821781 |
| 46 | 14.544 | 14.5074282178218 | 0.0365717821782191 |
| 47 | 13.812 | 13.5486782178218 | 0.263321782178218 |
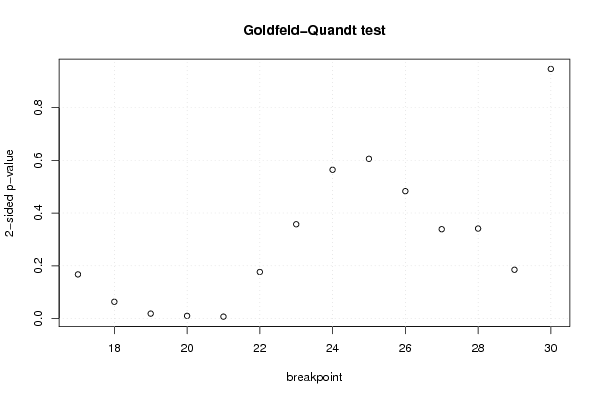
| Goldfeld-Quandt test for Heteroskedasticity | |||
| p-values | Alternative Hypothesis | ||
| breakpoint index | greater | 2-sided | less |
| 17 | 0.083573887834282 | 0.167147775668564 | 0.916426112165718 |
| 18 | 0.0316173946658073 | 0.0632347893316146 | 0.968382605334193 |
| 19 | 0.00917398762586119 | 0.0183479752517224 | 0.990826012374139 |
| 20 | 0.00486702951978889 | 0.00973405903957779 | 0.995132970480211 |
| 21 | 0.00340273913502678 | 0.00680547827005356 | 0.996597260864973 |
| 22 | 0.0881530695436393 | 0.176306139087279 | 0.91184693045636 |
| 23 | 0.178760044184147 | 0.357520088368295 | 0.821239955815853 |
| 24 | 0.282161854891963 | 0.564323709783925 | 0.717838145108037 |
| 25 | 0.302922618901052 | 0.605845237802105 | 0.697077381098948 |
| 26 | 0.241535351444628 | 0.483070702889256 | 0.758464648555372 |
| 27 | 0.169335211775099 | 0.338670423550198 | 0.830664788224901 |
| 28 | 0.170557228044433 | 0.341114456088866 | 0.829442771955567 |
| 29 | 0.0923994828843084 | 0.184798965768617 | 0.907600517115692 |
| 30 | 0.526534401956051 | 0.946931196087898 | 0.473465598043949 |
| Meta Analysis of Goldfeld-Quandt test for Heteroskedasticity | |||
| Description | # significant tests | % significant tests | OK/NOK |
| 1% type I error level | 2 | 0.142857142857143 | NOK |
| 5% type I error level | 3 | 0.214285714285714 | NOK |
| 10% type I error level | 4 | 0.285714285714286 | NOK |