| Multiple Linear Regression - Estimated Regression Equation |
| Y[t] = -50.7689952169571 + 1.50143938683308X[t] + 1.02889891057449`Y-1`[t] + 0.0692970396801225`Y-2`[t] -0.096239969622125`Y-3`[t] + 0.0796070883968342`Y-4`[t] + 1.10542849074488M1[t] + 2.83666815064074M2[t] + 21.7621760306343M3[t] + 8.36985452361509M4[t] -0.976767859694887M5[t] -0.366038911108393M6[t] -4.34479708974304M7[t] + 9.17821014476506M8[t] + 8.36123802230115M9[t] + 3.49196481587309M10[t] -1.56209812519408M11[t] -0.412873352380871t + e[t] |
| Multiple Linear Regression - Ordinary Least Squares | |||||
| Variable | Parameter | S.D. | T-STAT H0: parameter = 0 | 2-tail p-value | 1-tail p-value |
| (Intercept) | -50.7689952169571 | 27.791734 | -1.8268 | 0.075598 | 0.037799 |
| X | 1.50143938683308 | 0.942626 | 1.5928 | 0.119485 | 0.059742 |
| `Y-1` | 1.02889891057449 | 0.156649 | 6.5682 | 0 | 0 |
| `Y-2` | 0.0692970396801225 | 0.220374 | 0.3145 | 0.754898 | 0.377449 |
| `Y-3` | -0.096239969622125 | 0.246883 | -0.3898 | 0.698846 | 0.349423 |
| `Y-4` | 0.0796070883968342 | 0.199732 | 0.3986 | 0.692441 | 0.346221 |
| M1 | 1.10542849074488 | 2.919108 | 0.3787 | 0.707028 | 0.353514 |
| M2 | 2.83666815064074 | 3.282921 | 0.8641 | 0.392972 | 0.196486 |
| M3 | 21.7621760306343 | 3.209825 | 6.7799 | 0 | 0 |
| M4 | 8.36985452361509 | 4.803 | 1.7426 | 0.089487 | 0.044743 |
| M5 | -0.976767859694887 | 4.242871 | -0.2302 | 0.81916 | 0.40958 |
| M6 | -0.366038911108393 | 3.831906 | -0.0955 | 0.924401 | 0.4622 |
| M7 | -4.34479708974304 | 2.913872 | -1.4911 | 0.144198 | 0.072099 |
| M8 | 9.17821014476506 | 3.159705 | 2.9048 | 0.006095 | 0.003047 |
| M9 | 8.36123802230115 | 3.4079 | 2.4535 | 0.018846 | 0.009423 |
| M10 | 3.49196481587309 | 3.70108 | 0.9435 | 0.351386 | 0.175693 |
| M11 | -1.56209812519408 | 3.503816 | -0.4458 | 0.658252 | 0.329126 |
| t | -0.412873352380871 | 0.1809 | -2.2823 | 0.028156 | 0.014078 |
| Multiple Linear Regression - Regression Statistics | |
| Multiple R | 0.995084348560634 |
| R-squared | 0.990192860750342 |
| Adjusted R-squared | 0.98580545634918 |
| F-TEST (value) | 225.689900043838 |
| F-TEST (DF numerator) | 17 |
| F-TEST (DF denominator) | 38 |
| p-value | 0 |
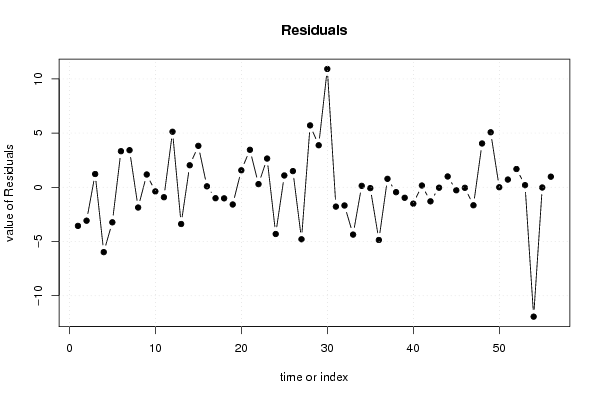
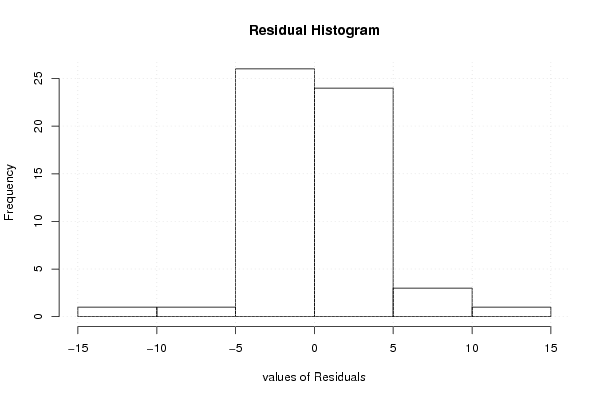
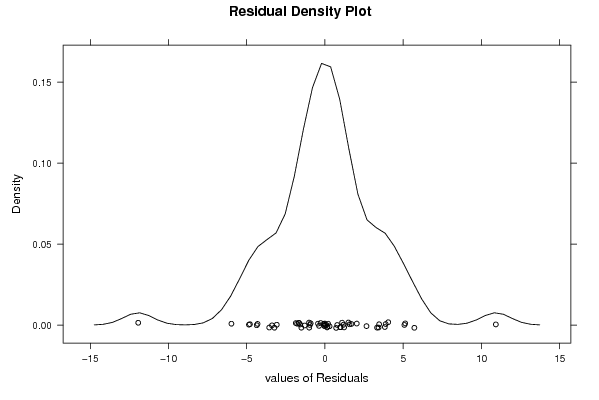
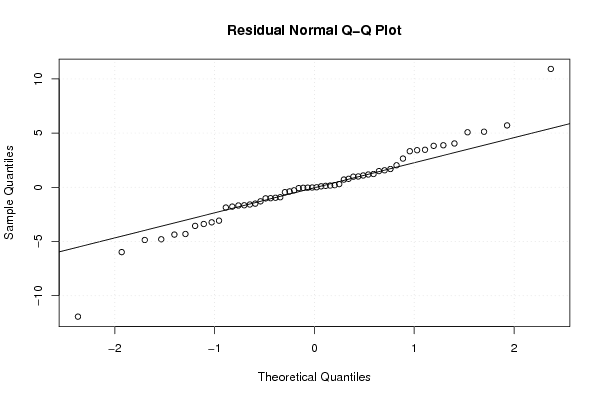
| Multiple Linear Regression - Residual Statistics | |
| Residual Standard Deviation | 4.10438021253102 |
| Sum Squared Residuals | 640.145603302616 |
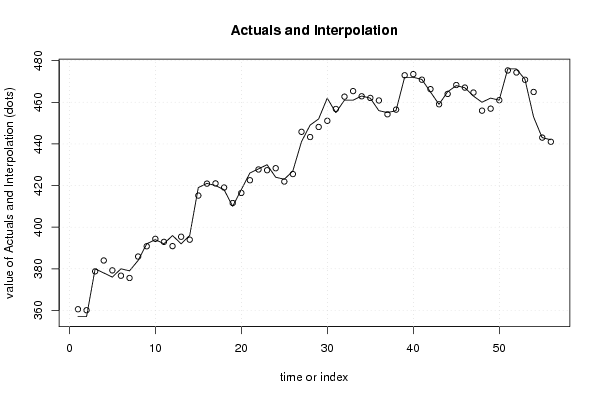
| Multiple Linear Regression - Actuals, Interpolation, and Residuals | |||
| Time or Index | Actuals | Interpolation Forecast | Residuals Prediction Error |
| 1 | 357 | 360.562529952468 | -3.5625299524681 |
| 2 | 357 | 360.080783454294 | -3.08078345429388 |
| 3 | 380 | 378.775569763257 | 1.22443023674308 |
| 4 | 378 | 383.979080152892 | -5.97908015289216 |
| 5 | 376 | 379.231337151581 | -3.23133715158071 |
| 6 | 380 | 376.670864871485 | 3.32913512851537 |
| 7 | 379 | 375.577086979479 | 3.42291302052129 |
| 8 | 384 | 385.866760730636 | -1.86676073063622 |
| 9 | 392 | 390.819522039218 | 1.18047796078205 |
| 10 | 394 | 394.379576347932 | -0.379576347931704 |
| 11 | 392 | 392.915878459449 | -0.915878459449176 |
| 12 | 396 | 390.873151543381 | 5.12684845661903 |
| 13 | 392 | 395.38650925788 | -3.38650925787988 |
| 14 | 396 | 393.968881891272 | 2.03111810872814 |
| 15 | 419 | 415.175174092447 | 3.82482590755343 |
| 16 | 421 | 420.910336651824 | 0.0896633481763578 |
| 17 | 420 | 421.005703597281 | -1.00570359728091 |
| 18 | 418 | 419.018739169284 | -1.01873916928398 |
| 19 | 410 | 411.586048913706 | -1.58604891370606 |
| 20 | 418 | 416.43170763961 | 1.56829236039037 |
| 21 | 426 | 422.541118166717 | 3.45888183328273 |
| 22 | 428 | 427.706252360912 | 0.293747639088286 |
| 23 | 430 | 427.348456147668 | 2.65154385233204 |
| 24 | 424 | 428.308850690938 | -4.30885069093845 |
| 25 | 423 | 421.909543826313 | 1.09045617368688 |
| 26 | 427 | 425.503561689805 | 1.49643831019501 |
| 27 | 441 | 445.796270040896 | -4.79627004089573 |
| 28 | 449 | 443.288566753834 | 5.71143324616601 |
| 29 | 452 | 448.121467500024 | 3.87853249997556 |
| 30 | 462 | 451.081608862955 | 10.9183911370446 |
| 31 | 455 | 456.780717343887 | -1.78071734388728 |
| 32 | 461 | 462.678658476319 | -1.67865847631945 |
| 33 | 461 | 465.362541185347 | -4.36254118534685 |
| 34 | 463 | 462.866791168042 | 0.133208831958288 |
| 35 | 462 | 462.076561726315 | -0.0765617263147584 |
| 36 | 456 | 460.861252995412 | -4.86125299541173 |
| 37 | 455 | 454.217774059305 | 0.782225940695417 |
| 38 | 456 | 456.448928506146 | -0.448928506146453 |
| 39 | 472 | 472.965687044273 | -0.965687044273305 |
| 40 | 472 | 473.509041968787 | -1.50904196878662 |
| 41 | 471 | 470.838353295974 | 0.161646704025597 |
| 42 | 465 | 466.294918475799 | -1.29491847579875 |
| 43 | 459 | 459.036324997572 | -0.0363249975718326 |
| 44 | 465 | 464.001939822277 | 0.998060177722865 |
| 45 | 468 | 468.276818608718 | -0.276818608717929 |
| 46 | 467 | 467.047380123115 | -0.0473801231148656 |
| 47 | 463 | 464.659103666568 | -1.65910366656811 |
| 48 | 460 | 455.956744770269 | 4.04325522973114 |
| 49 | 462 | 456.923642904034 | 5.07635709596568 |
| 50 | 461 | 460.997844458483 | 0.002155541517185 |
| 51 | 476 | 475.287299059127 | 0.712700940872513 |
| 52 | 476 | 474.312974472664 | 1.68702552733641 |
| 53 | 471 | 470.80313845514 | 0.196861544860468 |
| 54 | 453 | 464.933868620477 | -11.9338686204772 |
| 55 | 443 | 443.019821765356 | -0.0198217653561182 |
| 56 | 442 | 441.020933331158 | 0.979066668842426 |
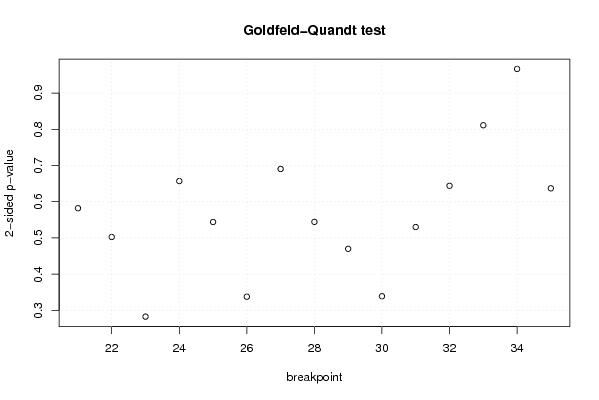
| Goldfeld-Quandt test for Heteroskedasticity | |||
| p-values | Alternative Hypothesis | ||
| breakpoint index | greater | 2-sided | less |
| 21 | 0.291024698656097 | 0.582049397312195 | 0.708975301343903 |
| 22 | 0.251323595142964 | 0.502647190285929 | 0.748676404857036 |
| 23 | 0.141365157608957 | 0.282730315217915 | 0.858634842391043 |
| 24 | 0.328521061334668 | 0.657042122669336 | 0.671478938665332 |
| 25 | 0.272042510055742 | 0.544085020111484 | 0.727957489944258 |
| 26 | 0.168877151479702 | 0.337754302959404 | 0.831122848520298 |
| 27 | 0.345278097998737 | 0.690556195997474 | 0.654721902001263 |
| 28 | 0.272205391478325 | 0.54441078295665 | 0.727794608521675 |
| 29 | 0.235009743277931 | 0.470019486555862 | 0.764990256722069 |
| 30 | 0.830452793786638 | 0.339094412426724 | 0.169547206213362 |
| 31 | 0.734924834750314 | 0.530150330499372 | 0.265075165249686 |
| 32 | 0.677945562172084 | 0.644108875655832 | 0.322054437827916 |
| 33 | 0.594412009928602 | 0.811175980142796 | 0.405587990071398 |
| 34 | 0.483313113556076 | 0.966626227112153 | 0.516686886443924 |
| 35 | 0.318538159796684 | 0.637076319593369 | 0.681461840203316 |
| Meta Analysis of Goldfeld-Quandt test for Heteroskedasticity | |||
| Description | # significant tests | % significant tests | OK/NOK |
| 1% type I error level | 0 | 0 | OK |
| 5% type I error level | 0 | 0 | OK |
| 10% type I error level | 0 | 0 | OK |