| Multiple Linear Regression - Estimated Regression Equation |
| Werkl[t] = + 133.503019293675 -0.237213983652731Infl[t] -0.395389499003M1[t] -0.68208142249928M2[t] -0.477935528120714M3[t] -0.61473848967676M4[t] -0.664425031723232M5[t] -0.76494939164455M6[t] -0.829343200677488M7[t] -0.957532433448864M8[t] -0.769591115331858M9[t] + 0.364117363765983M10[t] + 0.502970525131017M11[t] -0.0522111698227556t + e[t] |
| Multiple Linear Regression - Ordinary Least Squares | |||||
| Variable | Parameter | S.D. | T-STAT H0: parameter = 0 | 2-tail p-value | 1-tail p-value |
| (Intercept) | 133.503019293675 | 4.668324 | 28.5976 | 0 | 0 |
| Infl | -0.237213983652731 | 0.045466 | -5.2174 | 4e-06 | 2e-06 |
| M1 | -0.395389499003 | 0.349086 | -1.1326 | 0.263234 | 0.131617 |
| M2 | -0.68208142249928 | 0.348157 | -1.9591 | 0.056176 | 0.028088 |
| M3 | -0.477935528120714 | 0.347639 | -1.3748 | 0.175852 | 0.087926 |
| M4 | -0.61473848967676 | 0.347165 | -1.7707 | 0.08323 | 0.041615 |
| M5 | -0.664425031723232 | 0.346801 | -1.9159 | 0.061609 | 0.030805 |
| M6 | -0.76494939164455 | 0.346271 | -2.2091 | 0.032187 | 0.016093 |
| M7 | -0.829343200677488 | 0.345934 | -2.3974 | 0.020629 | 0.010315 |
| M8 | -0.957532433448864 | 0.345658 | -2.7702 | 0.008054 | 0.004027 |
| M9 | -0.769591115331858 | 0.345481 | -2.2276 | 0.03084 | 0.01542 |
| M10 | 0.364117363765983 | 0.345339 | 1.0544 | 0.297217 | 0.148608 |
| M11 | 0.502970525131017 | 0.345271 | 1.4567 | 0.151981 | 0.07599 |
| t | -0.0522111698227556 | 0.004192 | -12.4563 | 0 | 0 |
| Multiple Linear Regression - Regression Statistics | |
| Multiple R | 0.901808660837282 |
| R-squared | 0.813258860761132 |
| Adjusted R-squared | 0.760484190976235 |
| F-TEST (value) | 15.4100227263547 |
| F-TEST (DF numerator) | 13 |
| F-TEST (DF denominator) | 46 |
| p-value | 1.28741461935533e-12 |
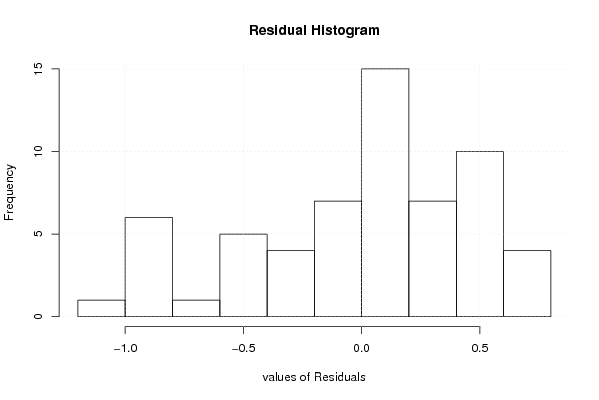
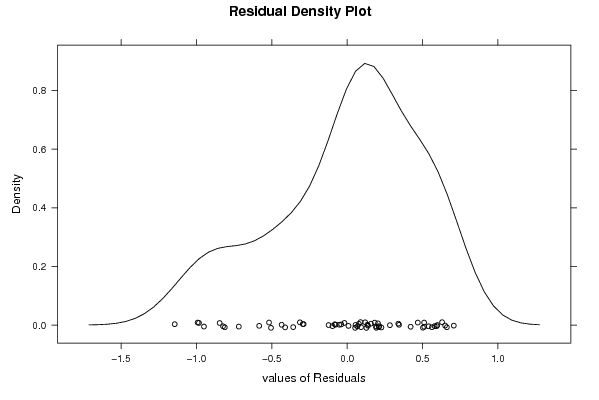
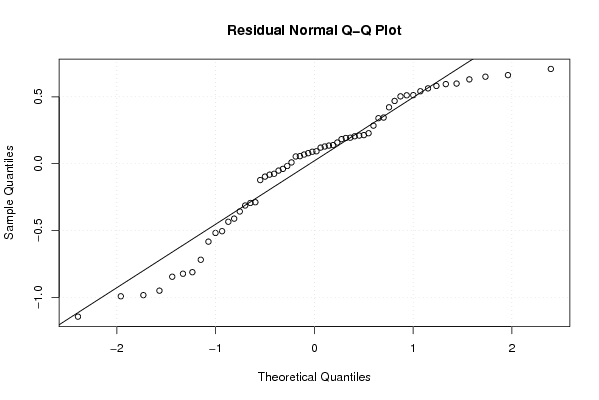
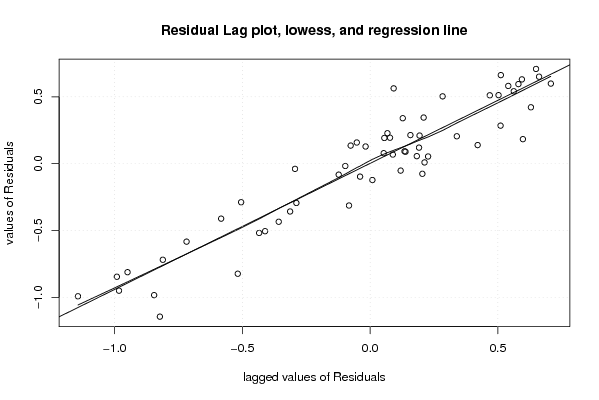
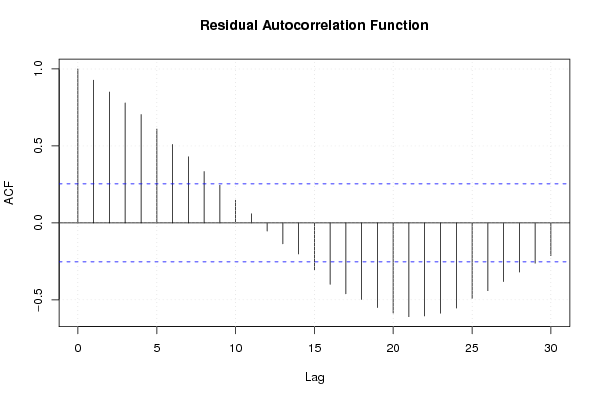
| Multiple Linear Regression - Residual Statistics | |
| Residual Standard Deviation | 0.545869860667813 |
| Sum Squared Residuals | 13.7067996201329 |
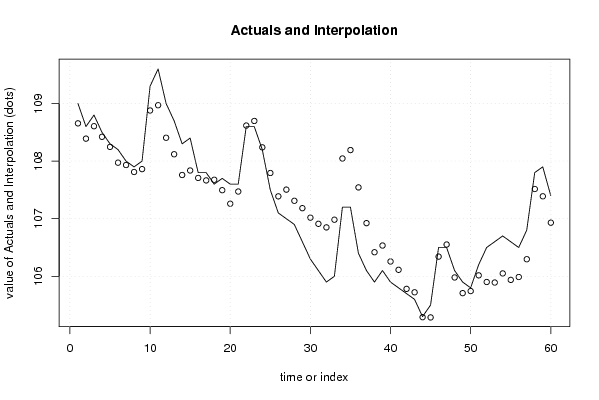
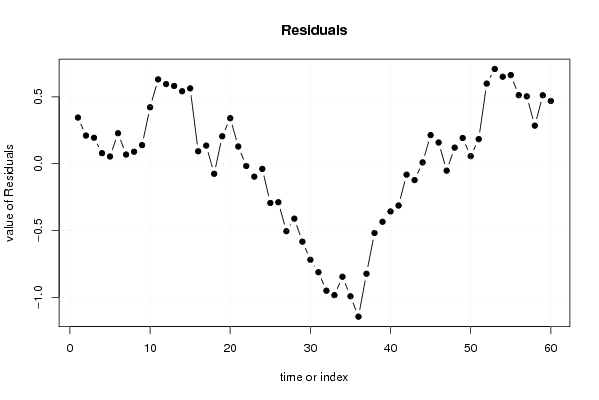
| Multiple Linear Regression - Actuals, Interpolation, and Residuals | |||
| Time or Index | Actuals | Interpolation Forecast | Residuals Prediction Error |
| 1 | 109 | 108.655588266329 | 0.34441173367093 |
| 2 | 108.6 | 108.390221507942 | 0.209778492057694 |
| 3 | 108.8 | 108.606204008084 | 0.193795991915651 |
| 4 | 108.5 | 108.421934156379 | 0.0780658436214021 |
| 5 | 108.3 | 108.246500109577 | 0.0534998904229708 |
| 6 | 108.2 | 107.97278544817 | 0.227214551829943 |
| 7 | 108 | 107.932088944083 | 0.0679110559167612 |
| 8 | 107.9 | 107.810992037402 | 0.089007962597716 |
| 9 | 108 | 107.861325151582 | 0.138674848418444 |
| 10 | 109.3 | 108.878774685270 | 0.421225314729592 |
| 11 | 109.6 | 108.970160956486 | 0.629839043514256 |
| 12 | 109 | 108.405490702186 | 0.594509297814142 |
| 13 | 108.7 | 108.119195542244 | 0.580804457756047 |
| 14 | 108.3 | 107.758943190396 | 0.541056809603818 |
| 15 | 108.4 | 107.837341580020 | 0.562658419980364 |
| 16 | 107.8 | 107.707630944554 | 0.0923690554459752 |
| 17 | 107.8 | 107.665036728598 | 0.134963271402020 |
| 18 | 107.6 | 107.675978847574 | -0.0759788475742943 |
| 19 | 107.7 | 107.495326093132 | 0.204673906867644 |
| 20 | 107.6 | 107.260366474298 | 0.339633525701897 |
| 21 | 107.6 | 107.472005097361 | 0.127994902638775 |
| 22 | 108.6 | 108.617550182223 | -0.0175501822225505 |
| 23 | 108.6 | 108.697075754255 | -0.0970757542552465 |
| 24 | 108.2 | 108.239151792599 | -0.0391517925990848 |
| 25 | 107.5 | 107.793923263610 | -0.29392326360986 |
| 26 | 107.1 | 107.388600254868 | -0.288600254868066 |
| 27 | 107 | 107.504952881876 | -0.504952881875959 |
| 28 | 106.9 | 107.311194470824 | -0.411194470824097 |
| 29 | 106.6 | 107.183203220753 | -0.583203220753081 |
| 30 | 106.3 | 107.018606991826 | -0.71860699182637 |
| 31 | 106.1 | 106.911490572317 | -0.811490572316786 |
| 32 | 105.9 | 106.849697161549 | -0.94969716154901 |
| 33 | 106 | 106.983055170007 | -0.983055170006736 |
| 34 | 107.2 | 108.045575360590 | -0.8455753605896 |
| 35 | 107.2 | 108.191520848045 | -0.99152084804506 |
| 36 | 106.4 | 107.543825699467 | -1.14382569946672 |
| 37 | 106.1 | 106.923058822574 | -0.823058822574485 |
| 38 | 105.9 | 106.418105940699 | -0.518105940698526 |
| 39 | 106.1 | 106.534458567706 | -0.434458567706437 |
| 40 | 105.9 | 106.257675262376 | -0.357675262376115 |
| 41 | 105.8 | 106.113079033449 | -0.313079033449403 |
| 42 | 105.7 | 105.782433015966 | -0.082433015965776 |
| 43 | 105.6 | 105.722759393187 | -0.122759393186745 |
| 44 | 105.3 | 105.290912167921 | 0.00908783207928167 |
| 45 | 105.5 | 105.286686065860 | 0.213313934140147 |
| 46 | 106.5 | 106.342089836933 | 0.157910163066861 |
| 47 | 106.5 | 106.552083099975 | -0.0520830999748357 |
| 48 | 106.1 | 105.980296426165 | 0.119703573834622 |
| 49 | 105.9 | 105.708234105243 | 0.191765894757368 |
| 50 | 105.8 | 105.744129106095 | 0.0558708939050803 |
| 51 | 106.2 | 106.017042962314 | 0.182957037686382 |
| 52 | 106.5 | 105.901565165867 | 0.598434834132834 |
| 53 | 106.6 | 105.892180907623 | 0.707819092377494 |
| 54 | 106.7 | 106.050195696464 | 0.649804303536497 |
| 55 | 106.6 | 105.938334997281 | 0.661665002719125 |
| 56 | 106.5 | 105.988032158830 | 0.511967841170114 |
| 57 | 106.8 | 106.296928515191 | 0.50307148480937 |
| 58 | 107.8 | 107.516009934984 | 0.283990065015698 |
| 59 | 107.9 | 107.389159341239 | 0.510840658760887 |
| 60 | 107.4 | 106.931235379583 | 0.468764620417040 |
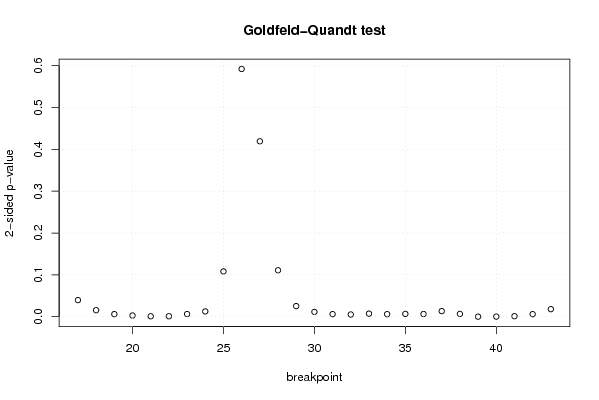
| Goldfeld-Quandt test for Heteroskedasticity | |||
| p-values | Alternative Hypothesis | ||
| breakpoint index | greater | 2-sided | less |
| 17 | 0.0198476052914280 | 0.0396952105828559 | 0.980152394708572 |
| 18 | 0.00777913085971494 | 0.0155582617194299 | 0.992220869140285 |
| 19 | 0.00307654480674009 | 0.00615308961348017 | 0.99692345519326 |
| 20 | 0.00142296975134588 | 0.00284593950269176 | 0.998577030248654 |
| 21 | 0.00050267747581979 | 0.00100535495163958 | 0.99949732252418 |
| 22 | 0.000536608823162407 | 0.00107321764632481 | 0.999463391176838 |
| 23 | 0.00317974886813432 | 0.00635949773626864 | 0.996820251131866 |
| 24 | 0.00631426700466357 | 0.0126285340093271 | 0.993685732995336 |
| 25 | 0.0541568426546244 | 0.108313685309249 | 0.945843157345376 |
| 26 | 0.296163151707604 | 0.592326303415207 | 0.703836848292396 |
| 27 | 0.790325707581018 | 0.419348584837963 | 0.209674292418982 |
| 28 | 0.944505234268225 | 0.110989531463549 | 0.0554947657317745 |
| 29 | 0.987323622804882 | 0.0253527543902364 | 0.0126763771951182 |
| 30 | 0.994239813775113 | 0.0115203724497748 | 0.00576018622488741 |
| 31 | 0.996916249286194 | 0.00616750142761222 | 0.00308375071380611 |
| 32 | 0.997327231448106 | 0.00534553710378742 | 0.00267276855189371 |
| 33 | 0.996335608944198 | 0.00732878211160405 | 0.00366439105580203 |
| 34 | 0.99697869559347 | 0.00604260881305923 | 0.00302130440652961 |
| 35 | 0.996663436221505 | 0.00667312755698998 | 0.00333656377849499 |
| 36 | 0.996804017456716 | 0.00639196508656791 | 0.00319598254328395 |
| 37 | 0.99332347155526 | 0.0133530568894814 | 0.0066765284447407 |
| 38 | 0.996656789996578 | 0.00668642000684422 | 0.00334321000342211 |
| 39 | 0.999936132141335 | 0.000127735717330363 | 6.38678586651816e-05 |
| 40 | 0.999894844120282 | 0.000210311759437011 | 0.000105155879718505 |
| 41 | 0.999394073892622 | 0.00121185221475576 | 0.000605926107377879 |
| 42 | 0.99696684778466 | 0.00606630443067963 | 0.00303315221533982 |
| 43 | 0.990994506291557 | 0.0180109874168857 | 0.00900549370844284 |
| Meta Analysis of Goldfeld-Quandt test for Heteroskedasticity | |||
| Description | # significant tests | % significant tests | OK/NOK |
| 1% type I error level | 16 | 0.592592592592593 | NOK |
| 5% type I error level | 23 | 0.851851851851852 | NOK |
| 10% type I error level | 23 | 0.851851851851852 | NOK |