| Multiple Linear Regression - Estimated Regression Equation |
| Y[t] = + 9.32222222222222 -1.55555555555556X[t] + e[t] |
| Multiple Linear Regression - Ordinary Least Squares | |||||
| Variable | Parameter | S.D. | T-STAT H0: parameter = 0 | 2-tail p-value | 1-tail p-value |
| (Intercept) | 9.32222222222222 | 0.094219 | 98.9423 | 0 | 0 |
| X | -1.55555555555556 | 0.148973 | -10.4419 | 0 | 0 |
| Multiple Linear Regression - Regression Statistics | |
| Multiple R | 0.807936981724256 |
| R-squared | 0.6527621664377 |
| Adjusted R-squared | 0.646775307238351 |
| F-TEST (value) | 109.032490109100 |
| F-TEST (DF numerator) | 1 |
| F-TEST (DF denominator) | 58 |
| p-value | 6.10622663543836e-15 |
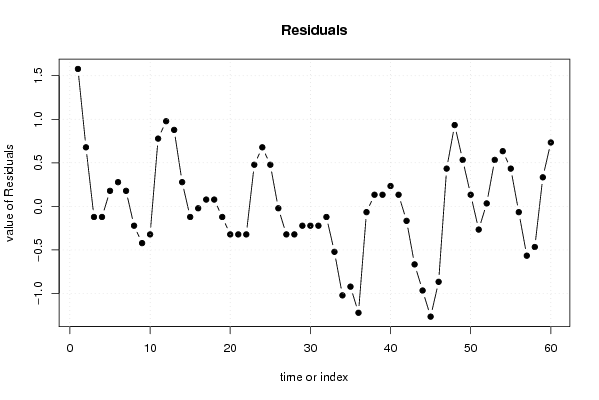
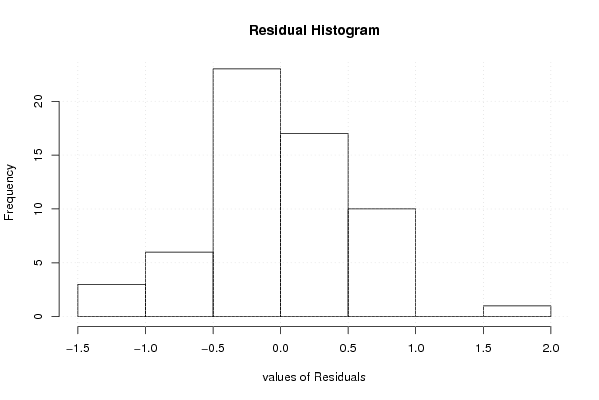
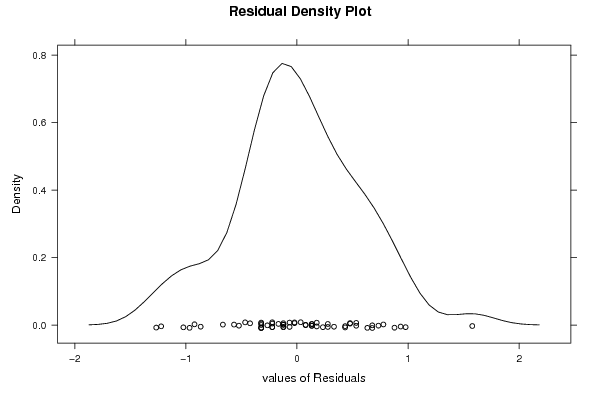
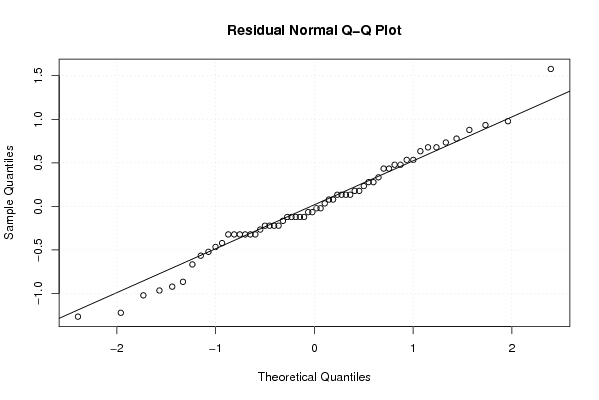
| Multiple Linear Regression - Residual Statistics | |
| Residual Standard Deviation | 0.565312784271948 |
| Sum Squared Residuals | 18.5355555555555 |
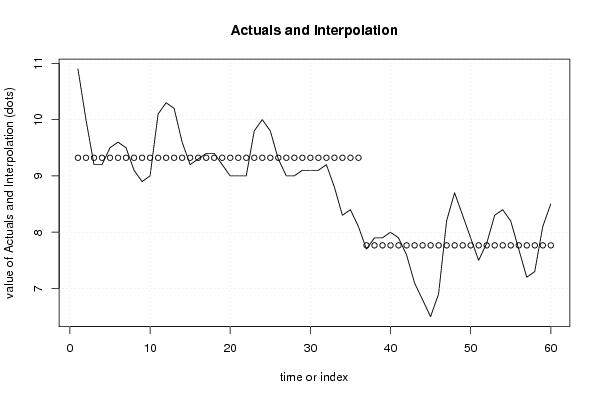
| Multiple Linear Regression - Actuals, Interpolation, and Residuals | |||
| Time or Index | Actuals | Interpolation Forecast | Residuals Prediction Error |
| 1 | 10.9 | 9.32222222222222 | 1.57777777777778 |
| 2 | 10 | 9.32222222222222 | 0.67777777777778 |
| 3 | 9.2 | 9.32222222222222 | -0.122222222222223 |
| 4 | 9.2 | 9.32222222222222 | -0.122222222222223 |
| 5 | 9.5 | 9.32222222222222 | 0.177777777777778 |
| 6 | 9.6 | 9.32222222222222 | 0.277777777777778 |
| 7 | 9.5 | 9.32222222222222 | 0.177777777777778 |
| 8 | 9.1 | 9.32222222222222 | -0.222222222222222 |
| 9 | 8.9 | 9.32222222222222 | -0.422222222222222 |
| 10 | 9 | 9.32222222222222 | -0.322222222222222 |
| 11 | 10.1 | 9.32222222222222 | 0.777777777777778 |
| 12 | 10.3 | 9.32222222222222 | 0.977777777777779 |
| 13 | 10.2 | 9.32222222222222 | 0.877777777777777 |
| 14 | 9.6 | 9.32222222222222 | 0.277777777777778 |
| 15 | 9.2 | 9.32222222222222 | -0.122222222222223 |
| 16 | 9.3 | 9.32222222222222 | -0.0222222222222214 |
| 17 | 9.4 | 9.32222222222222 | 0.0777777777777783 |
| 18 | 9.4 | 9.32222222222222 | 0.0777777777777783 |
| 19 | 9.2 | 9.32222222222222 | -0.122222222222223 |
| 20 | 9 | 9.32222222222222 | -0.322222222222222 |
| 21 | 9 | 9.32222222222222 | -0.322222222222222 |
| 22 | 9 | 9.32222222222222 | -0.322222222222222 |
| 23 | 9.8 | 9.32222222222222 | 0.477777777777779 |
| 24 | 10 | 9.32222222222222 | 0.677777777777778 |
| 25 | 9.8 | 9.32222222222222 | 0.477777777777779 |
| 26 | 9.3 | 9.32222222222222 | -0.0222222222222214 |
| 27 | 9 | 9.32222222222222 | -0.322222222222222 |
| 28 | 9 | 9.32222222222222 | -0.322222222222222 |
| 29 | 9.1 | 9.32222222222222 | -0.222222222222222 |
| 30 | 9.1 | 9.32222222222222 | -0.222222222222222 |
| 31 | 9.1 | 9.32222222222222 | -0.222222222222222 |
| 32 | 9.2 | 9.32222222222222 | -0.122222222222223 |
| 33 | 8.8 | 9.32222222222222 | -0.522222222222221 |
| 34 | 8.3 | 9.32222222222222 | -1.02222222222222 |
| 35 | 8.4 | 9.32222222222222 | -0.922222222222222 |
| 36 | 8.1 | 9.32222222222222 | -1.22222222222222 |
| 37 | 7.7 | 7.76666666666667 | -0.0666666666666666 |
| 38 | 7.9 | 7.76666666666667 | 0.133333333333334 |
| 39 | 7.9 | 7.76666666666667 | 0.133333333333334 |
| 40 | 8 | 7.76666666666667 | 0.233333333333333 |
| 41 | 7.9 | 7.76666666666667 | 0.133333333333334 |
| 42 | 7.6 | 7.76666666666667 | -0.166666666666667 |
| 43 | 7.1 | 7.76666666666667 | -0.666666666666667 |
| 44 | 6.8 | 7.76666666666667 | -0.966666666666667 |
| 45 | 6.5 | 7.76666666666667 | -1.26666666666667 |
| 46 | 6.9 | 7.76666666666667 | -0.866666666666666 |
| 47 | 8.2 | 7.76666666666667 | 0.433333333333333 |
| 48 | 8.7 | 7.76666666666667 | 0.933333333333333 |
| 49 | 8.3 | 7.76666666666667 | 0.533333333333334 |
| 50 | 7.9 | 7.76666666666667 | 0.133333333333334 |
| 51 | 7.5 | 7.76666666666667 | -0.266666666666667 |
| 52 | 7.8 | 7.76666666666667 | 0.0333333333333331 |
| 53 | 8.3 | 7.76666666666667 | 0.533333333333334 |
| 54 | 8.4 | 7.76666666666667 | 0.633333333333334 |
| 55 | 8.2 | 7.76666666666667 | 0.433333333333333 |
| 56 | 7.7 | 7.76666666666667 | -0.0666666666666666 |
| 57 | 7.2 | 7.76666666666667 | -0.566666666666667 |
| 58 | 7.3 | 7.76666666666667 | -0.466666666666667 |
| 59 | 8.1 | 7.76666666666667 | 0.333333333333333 |
| 60 | 8.5 | 7.76666666666667 | 0.733333333333333 |
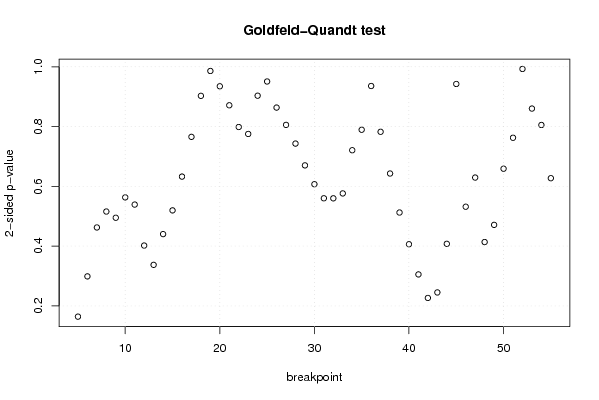
| Goldfeld-Quandt test for Heteroskedasticity | |||
| p-values | Alternative Hypothesis | ||
| breakpoint index | greater | 2-sided | less |
| 5 | 0.918007370058325 | 0.163985259883349 | 0.0819926299416747 |
| 6 | 0.850615930925037 | 0.298768138149926 | 0.149384069074963 |
| 7 | 0.768802624743277 | 0.462394750513446 | 0.231197375256723 |
| 8 | 0.742163498772428 | 0.515673002455145 | 0.257836501227572 |
| 9 | 0.752578985518163 | 0.494842028963674 | 0.247421014481837 |
| 10 | 0.718469973703824 | 0.563060052592351 | 0.281530026296176 |
| 11 | 0.730513675788857 | 0.538972648422287 | 0.269486324211143 |
| 12 | 0.799040434189397 | 0.401919131621206 | 0.200959565810603 |
| 13 | 0.831329850961285 | 0.337340298077430 | 0.168670149038715 |
| 14 | 0.779918911196258 | 0.440162177607484 | 0.220081088803742 |
| 15 | 0.740204373150153 | 0.519591253699694 | 0.259795626849847 |
| 16 | 0.683714873465291 | 0.632570253069418 | 0.316285126534709 |
| 17 | 0.617232030202464 | 0.765535939595072 | 0.382767969797536 |
| 18 | 0.548635559846282 | 0.902728880307436 | 0.451364440153718 |
| 19 | 0.492986311944955 | 0.98597262388991 | 0.507013688055045 |
| 20 | 0.467373325446833 | 0.934746650893666 | 0.532626674553167 |
| 21 | 0.435568136542705 | 0.87113627308541 | 0.564431863457295 |
| 22 | 0.399230803195447 | 0.798461606390893 | 0.600769196804553 |
| 23 | 0.387604943578951 | 0.775209887157902 | 0.612395056421049 |
| 24 | 0.451611970823418 | 0.903223941646835 | 0.548388029176582 |
| 25 | 0.475406145450062 | 0.950812290900123 | 0.524593854549938 |
| 26 | 0.431741187855749 | 0.863482375711497 | 0.568258812144251 |
| 27 | 0.402747688191409 | 0.805495376382819 | 0.597252311808591 |
| 28 | 0.371515616959365 | 0.74303123391873 | 0.628484383040635 |
| 29 | 0.335058654819736 | 0.670117309639472 | 0.664941345180264 |
| 30 | 0.303564267671022 | 0.607128535342043 | 0.696435732328978 |
| 31 | 0.280015082675317 | 0.560030165350635 | 0.719984917324683 |
| 32 | 0.279968240115542 | 0.559936480231084 | 0.720031759884458 |
| 33 | 0.288151654913869 | 0.576303309827737 | 0.711848345086131 |
| 34 | 0.360402899637518 | 0.720805799275037 | 0.639597100362482 |
| 35 | 0.394630284030537 | 0.789260568061073 | 0.605369715969463 |
| 36 | 0.467835387411792 | 0.935670774823583 | 0.532164612588208 |
| 37 | 0.391230500761587 | 0.782461001523174 | 0.608769499238413 |
| 38 | 0.321439642558603 | 0.642879285117207 | 0.678560357441397 |
| 39 | 0.256168773422883 | 0.512337546845767 | 0.743831226577117 |
| 40 | 0.203123876603134 | 0.406247753206267 | 0.796876123396866 |
| 41 | 0.152661701177379 | 0.305323402354758 | 0.84733829882262 |
| 42 | 0.113270912753961 | 0.226541825507922 | 0.886729087246039 |
| 43 | 0.122510063488452 | 0.245020126976903 | 0.877489936511548 |
| 44 | 0.203822977369796 | 0.407645954739591 | 0.796177022630205 |
| 45 | 0.528743550738852 | 0.942512898522295 | 0.471256449261148 |
| 46 | 0.734119384192428 | 0.531761231615144 | 0.265880615807572 |
| 47 | 0.685326420359947 | 0.629347159280106 | 0.314673579640053 |
| 48 | 0.79323281442539 | 0.413534371149219 | 0.206767185574610 |
| 49 | 0.764491988975164 | 0.471016022049673 | 0.235508011024836 |
| 50 | 0.670523980082705 | 0.65895203983459 | 0.329476019917295 |
| 51 | 0.618742544756781 | 0.762514910486438 | 0.381257455243219 |
| 52 | 0.503638140737694 | 0.992723718524612 | 0.496361859262306 |
| 53 | 0.430081428583591 | 0.860162857167182 | 0.569918571416409 |
| 54 | 0.402626270504171 | 0.805252541008343 | 0.597373729495829 |
| 55 | 0.313603491866021 | 0.627206983732042 | 0.686396508133979 |
| Meta Analysis of Goldfeld-Quandt test for Heteroskedasticity | |||
| Description | # significant tests | % significant tests | OK/NOK |
| 1% type I error level | 0 | 0 | OK |
| 5% type I error level | 0 | 0 | OK |
| 10% type I error level | 0 | 0 | OK |