| Multiple Linear Regression - Estimated Regression Equation |
| Y[t] = -2.89999021216690 + 0.873627997570757X[t] + 0.0245492114319014Y1[t] + 0.145315150831421Y2[t] + 0.110701724083021Y3[t] -0.0225391490188104Y4[t] -0.361337024228986M1[t] -0.0556593556308913M2[t] -0.472649033262836M3[t] + 0.625633258667187M4[t] -0.223770882850354M5[t] + 0.365365125566834M6[t] + 0.360498507612941M7[t] + 0.676362526335275M8[t] + 0.420586202713588M9[t] + 0.0485506948041424M10[t] + 0.465680688403872M11[t] + 0.00673586861246828t + e[t] |
| Multiple Linear Regression - Ordinary Least Squares | |||||
| Variable | Parameter | S.D. | T-STAT H0: parameter = 0 | 2-tail p-value | 1-tail p-value |
| (Intercept) | -2.89999021216690 | 0.61411 | -4.7223 | 1.6e-05 | 8e-06 |
| X | 0.873627997570757 | 0.048506 | 18.0107 | 0 | 0 |
| Y1 | 0.0245492114319014 | 0.05289 | 0.4642 | 0.644338 | 0.322169 |
| Y2 | 0.145315150831421 | 0.048801 | 2.9777 | 0.004286 | 0.002143 |
| Y3 | 0.110701724083021 | 0.050477 | 2.1931 | 0.032469 | 0.016235 |
| Y4 | -0.0225391490188104 | 0.057631 | -0.3911 | 0.697212 | 0.348606 |
| M1 | -0.361337024228986 | 0.260616 | -1.3865 | 0.171097 | 0.085549 |
| M2 | -0.0556593556308913 | 0.27146 | -0.205 | 0.838286 | 0.419143 |
| M3 | -0.472649033262836 | 0.256836 | -1.8403 | 0.071029 | 0.035514 |
| M4 | 0.625633258667187 | 0.289713 | 2.1595 | 0.03511 | 0.017555 |
| M5 | -0.223770882850354 | 0.316335 | -0.7074 | 0.482261 | 0.24113 |
| M6 | 0.365365125566834 | 0.29628 | 1.2332 | 0.222661 | 0.111331 |
| M7 | 0.360498507612941 | 0.243658 | 1.4795 | 0.144603 | 0.072302 |
| M8 | 0.676362526335275 | 0.284027 | 2.3813 | 0.020674 | 0.010337 |
| M9 | 0.420586202713588 | 0.268535 | 1.5662 | 0.12293 | 0.061465 |
| M10 | 0.0485506948041424 | 0.266358 | 0.1823 | 0.856025 | 0.428012 |
| M11 | 0.465680688403872 | 0.292402 | 1.5926 | 0.116878 | 0.058439 |
| t | 0.00673586861246828 | 0.004765 | 1.4137 | 0.16299 | 0.081495 |
| Multiple Linear Regression - Regression Statistics | |
| Multiple R | 0.992141366913702 |
| R-squared | 0.98434449194139 |
| Adjusted R-squared | 0.979591926995026 |
| F-TEST (value) | 207.118577662895 |
| F-TEST (DF numerator) | 17 |
| F-TEST (DF denominator) | 56 |
| p-value | 0 |
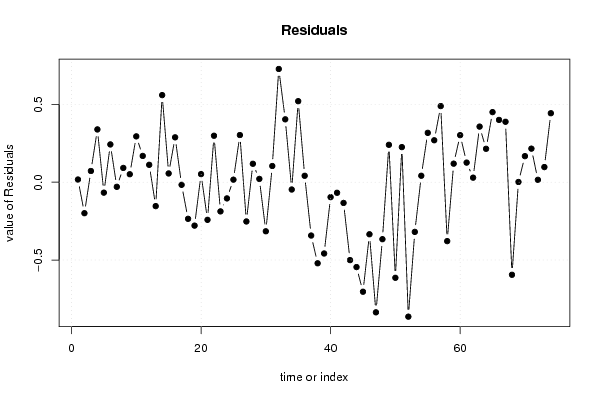
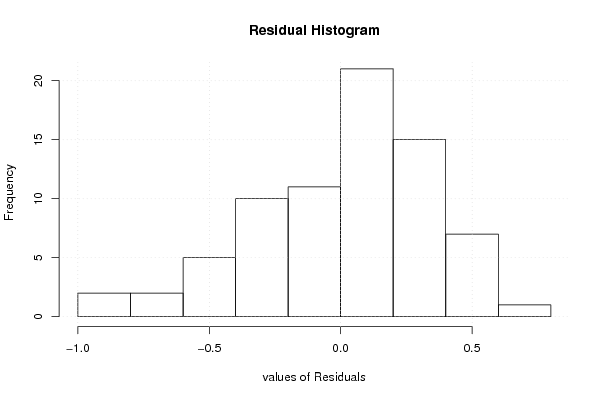
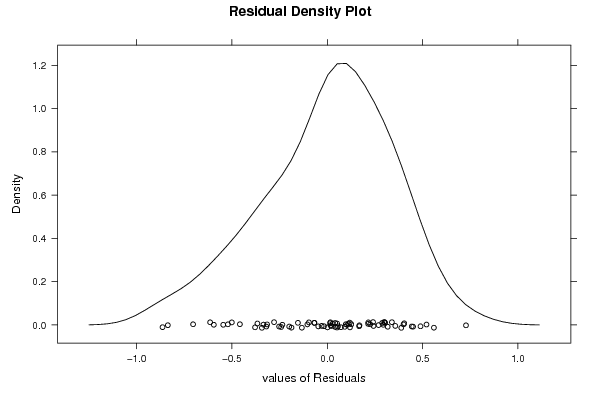
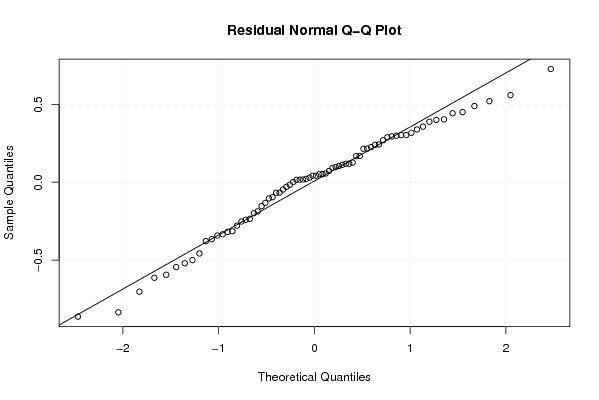
| Multiple Linear Regression - Residual Statistics | |
| Residual Standard Deviation | 0.385429189322686 |
| Sum Squared Residuals | 8.31911695898883 |
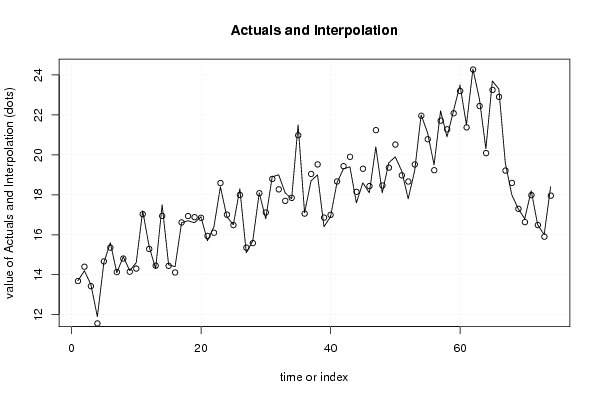
| Multiple Linear Regression - Actuals, Interpolation, and Residuals | |||
| Time or Index | Actuals | Interpolation Forecast | Residuals Prediction Error |
| 1 | 13.7 | 13.6828760417325 | 0.0171239582674963 |
| 2 | 14.2 | 14.3993450478646 | -0.199345047864642 |
| 3 | 13.5 | 13.4280233392573 | 0.0719766607427173 |
| 4 | 11.9 | 11.5609734627314 | 0.339026537268607 |
| 5 | 14.6 | 14.6671229011334 | -0.0671229011334472 |
| 6 | 15.6 | 15.3574638253597 | 0.242536174640255 |
| 7 | 14.1 | 14.1297202446051 | -0.0297202446051058 |
| 8 | 14.9 | 14.8084059593207 | 0.0915940406793455 |
| 9 | 14.2 | 14.1487897696708 | 0.0512102303291676 |
| 10 | 14.6 | 14.3055056661928 | 0.294494333807151 |
| 11 | 17.2 | 17.0312735038744 | 0.168726496125587 |
| 12 | 15.4 | 15.2883181717092 | 0.111681828290779 |
| 13 | 14.3 | 14.4537779240526 | -0.153777924052595 |
| 14 | 17.5 | 16.9404988741267 | 0.559501125873268 |
| 15 | 14.5 | 14.4438349898349 | 0.0561650101650815 |
| 16 | 14.4 | 14.1117565753433 | 0.288243424656726 |
| 17 | 16.6 | 16.6168757003131 | -0.0168757003130596 |
| 18 | 16.7 | 16.9353566780576 | -0.235356678057576 |
| 19 | 16.6 | 16.8791074575512 | -0.279107457551217 |
| 20 | 16.9 | 16.8480420484110 | 0.0519579515890279 |
| 21 | 15.7 | 15.9417792880156 | -0.241779288015571 |
| 22 | 16.4 | 16.101467851482 | 0.298532148517988 |
| 23 | 18.4 | 18.5876744067525 | -0.187674406752515 |
| 24 | 16.9 | 17.0042284049597 | -0.104228404959656 |
| 25 | 16.5 | 16.4837951209964 | 0.0162048790036415 |
| 26 | 18.3 | 17.9971214878390 | 0.302878512161034 |
| 27 | 15.1 | 15.3524549204894 | -0.252454920489449 |
| 28 | 15.7 | 15.5816573127565 | 0.118342687243487 |
| 29 | 18.1 | 18.0788636370471 | 0.0211363629529026 |
| 30 | 16.8 | 17.1155847303565 | -0.315584730356508 |
| 31 | 18.9 | 18.7959218760581 | 0.104078123941907 |
| 32 | 19 | 18.2723352623792 | 0.72766473762083 |
| 33 | 18.1 | 17.6960913475207 | 0.403908652479327 |
| 34 | 17.8 | 17.8470918465882 | -0.0470918465881536 |
| 35 | 21.5 | 20.9795196610748 | 0.520480338925197 |
| 36 | 17.1 | 17.0587777212295 | 0.0412222787705488 |
| 37 | 18.7 | 19.0428824049365 | -0.342882404936517 |
| 38 | 19 | 19.520997339621 | -0.520997339620994 |
| 39 | 16.4 | 16.8581485033708 | -0.458148503370805 |
| 40 | 16.9 | 16.9961490770563 | -0.0961490770563166 |
| 41 | 18.6 | 18.6680562884838 | -0.068056288483806 |
| 42 | 19.3 | 19.4331843720702 | -0.133184372070209 |
| 43 | 19.4 | 19.9005892763920 | -0.50058927639203 |
| 44 | 17.6 | 18.1454924534427 | -0.5454924534427 |
| 45 | 18.6 | 19.3037743825785 | -0.703774382578548 |
| 46 | 18.1 | 18.4346610520408 | -0.334661052040824 |
| 47 | 20.4 | 21.2362088343153 | -0.836208834315295 |
| 48 | 18.1 | 18.4661834245203 | -0.366183424520313 |
| 49 | 19.6 | 19.3598075155473 | 0.240192484452722 |
| 50 | 19.9 | 20.5143315604645 | -0.614331560464538 |
| 51 | 19.2 | 18.9746076359026 | 0.225392364097358 |
| 52 | 17.8 | 18.6640353271756 | -0.864035327175582 |
| 53 | 19.2 | 19.5192981412791 | -0.319298141279137 |
| 54 | 22 | 21.9585519457555 | 0.0414480542444776 |
| 55 | 21.1 | 20.7829531938282 | 0.317046806171787 |
| 56 | 19.5 | 19.2307200423467 | 0.269279957653273 |
| 57 | 22.2 | 21.7109112248166 | 0.489088775183414 |
| 58 | 20.9 | 21.2787374453993 | -0.378737445399308 |
| 59 | 22.2 | 22.0809283150931 | 0.119071684906883 |
| 60 | 23.5 | 23.1977498636498 | 0.302250136350196 |
| 61 | 21.5 | 21.3740368394466 | 0.125963160553397 |
| 62 | 24.3 | 24.2709075785906 | 0.0290924214094412 |
| 63 | 22.8 | 22.4429306111449 | 0.357069388855098 |
| 64 | 20.3 | 20.0854282449369 | 0.214571755063078 |
| 65 | 23.7 | 23.2497833317435 | 0.450216668256547 |
| 66 | 23.3 | 22.8998584484004 | 0.400141551599560 |
| 67 | 19.6 | 19.2117079515653 | 0.388292048434659 |
| 68 | 18 | 18.5950042340998 | -0.595004234099776 |
| 69 | 17.3 | 17.2986539873978 | 0.00134601260221030 |
| 70 | 16.8 | 16.6325361382969 | 0.167463861703146 |
| 71 | 18.2 | 17.9843952788899 | 0.215604721110143 |
| 72 | 16.5 | 16.4847424139316 | 0.0152575860684450 |
| 73 | 16 | 15.9028241532881 | 0.0971758467118542 |
| 74 | 18.4 | 17.9567981114936 | 0.44320188850643 |
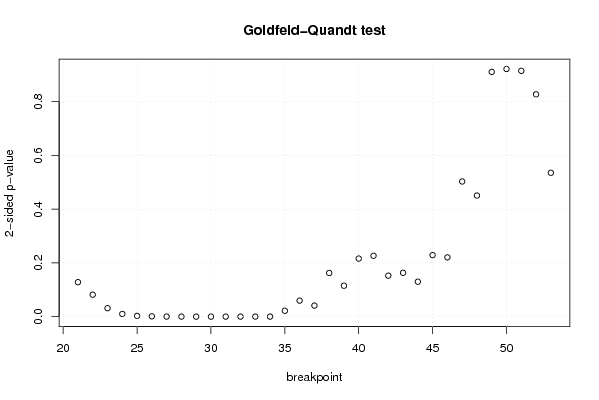
| Goldfeld-Quandt test for Heteroskedasticity | |||
| p-values | Alternative Hypothesis | ||
| breakpoint index | greater | 2-sided | less |
| 21 | 0.0641971159049376 | 0.128394231809875 | 0.935802884095062 |
| 22 | 0.0408515364863914 | 0.0817030729727828 | 0.959148463513609 |
| 23 | 0.0157285650222386 | 0.0314571300444772 | 0.984271434977761 |
| 24 | 0.0050195195193498 | 0.0100390390386996 | 0.99498048048065 |
| 25 | 0.00144717278473316 | 0.00289434556946631 | 0.998552827215267 |
| 26 | 0.00057606034223897 | 0.00115212068447794 | 0.99942393965776 |
| 27 | 0.000169414978809341 | 0.000338829957618682 | 0.99983058502119 |
| 28 | 0.000102782998268891 | 0.000205565996537782 | 0.99989721700173 |
| 29 | 3.32736923598257e-05 | 6.65473847196515e-05 | 0.99996672630764 |
| 30 | 1.10792150882343e-05 | 2.21584301764686e-05 | 0.999988920784912 |
| 31 | 3.28694967846295e-06 | 6.5738993569259e-06 | 0.999996713050322 |
| 32 | 2.22459011017784e-05 | 4.44918022035568e-05 | 0.999977754098898 |
| 33 | 0.000152991173549370 | 0.000305982347098741 | 0.99984700882645 |
| 34 | 7.3674708443508e-05 | 0.000147349416887016 | 0.999926325291556 |
| 35 | 0.0109442671875613 | 0.0218885343751226 | 0.989055732812439 |
| 36 | 0.0298143017275702 | 0.0596286034551403 | 0.97018569827243 |
| 37 | 0.0206038128162947 | 0.0412076256325893 | 0.979396187183705 |
| 38 | 0.0812936507326105 | 0.162587301465221 | 0.91870634926739 |
| 39 | 0.057572303440749 | 0.115144606881498 | 0.942427696559251 |
| 40 | 0.108116788395217 | 0.216233576790434 | 0.891883211604783 |
| 41 | 0.113263366731381 | 0.226526733462763 | 0.886736633268619 |
| 42 | 0.0762466262504644 | 0.152493252500929 | 0.923753373749536 |
| 43 | 0.081599091840301 | 0.163198183680602 | 0.9184009081597 |
| 44 | 0.065064337727802 | 0.130128675455604 | 0.934935662272198 |
| 45 | 0.114511083756197 | 0.229022167512393 | 0.885488916243803 |
| 46 | 0.110343809324946 | 0.220687618649892 | 0.889656190675054 |
| 47 | 0.251557976636825 | 0.50311595327365 | 0.748442023363175 |
| 48 | 0.225375855934951 | 0.450751711869902 | 0.77462414406505 |
| 49 | 0.455539255214478 | 0.911078510428957 | 0.544460744785522 |
| 50 | 0.53900790802638 | 0.921984183947239 | 0.460992091973620 |
| 51 | 0.457503723804777 | 0.915007447609554 | 0.542496276195223 |
| 52 | 0.41383234729944 | 0.82766469459888 | 0.58616765270056 |
| 53 | 0.267772766980162 | 0.535545533960324 | 0.732227233019838 |
| Meta Analysis of Goldfeld-Quandt test for Heteroskedasticity | |||
| Description | # significant tests | % significant tests | OK/NOK |
| 1% type I error level | 10 | 0.303030303030303 | NOK |
| 5% type I error level | 14 | 0.424242424242424 | NOK |
| 10% type I error level | 16 | 0.484848484848485 | NOK |