| Multiple Linear Regression - Estimated Regression Equation |
| Y[t] = + 9.74222222222222 -1.55555555555556X[t] + 0.259999999999998M1[t] -0.180000000000001M2[t] -0.560000000000001M3[t] -0.460000000000001M4[t] -0.28M5[t] -0.3M6[t] -0.500000000000001M7[t] -0.760000000000001M8[t] -1.04M9[t] -1.02M10[t] -0.200000000000000M11[t] + e[t] |
| Multiple Linear Regression - Ordinary Least Squares | |||||
| Variable | Parameter | S.D. | T-STAT H0: parameter = 0 | 2-tail p-value | 1-tail p-value |
| (Intercept) | 9.74222222222222 | 0.214083 | 45.5067 | 0 | 0 |
| X | -1.55555555555556 | 0.122785 | -12.6689 | 0 | 0 |
| M1 | 0.259999999999998 | 0.294684 | 0.8823 | 0.382105 | 0.191052 |
| M2 | -0.180000000000001 | 0.294684 | -0.6108 | 0.544259 | 0.27213 |
| M3 | -0.560000000000001 | 0.294684 | -1.9003 | 0.063532 | 0.031766 |
| M4 | -0.460000000000001 | 0.294684 | -1.561 | 0.125234 | 0.062617 |
| M5 | -0.28 | 0.294684 | -0.9502 | 0.346887 | 0.173443 |
| M6 | -0.3 | 0.294684 | -1.018 | 0.313871 | 0.156936 |
| M7 | -0.500000000000001 | 0.294684 | -1.6967 | 0.096362 | 0.048181 |
| M8 | -0.760000000000001 | 0.294684 | -2.579 | 0.013098 | 0.006549 |
| M9 | -1.04 | 0.294684 | -3.5292 | 0.000944 | 0.000472 |
| M10 | -1.02 | 0.294684 | -3.4613 | 0.001155 | 0.000577 |
| M11 | -0.200000000000000 | 0.294684 | -0.6787 | 0.500661 | 0.250331 |
| Multiple Linear Regression - Regression Statistics | |
| Multiple R | 0.89936121167632 |
| R-squared | 0.8088505890679 |
| Adjusted R-squared | 0.760046484149065 |
| F-TEST (value) | 16.5734130441095 |
| F-TEST (DF numerator) | 12 |
| F-TEST (DF denominator) | 47 |
| p-value | 5.09037256790634e-13 |
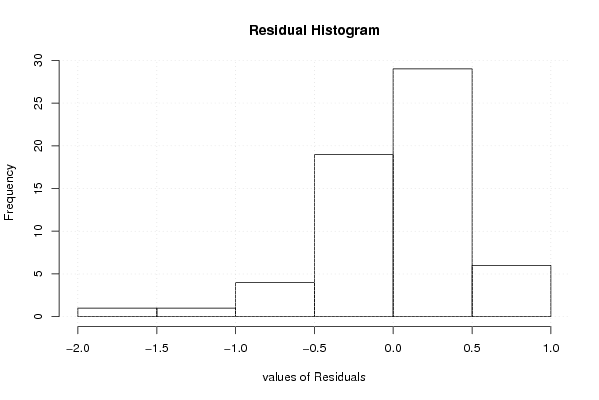
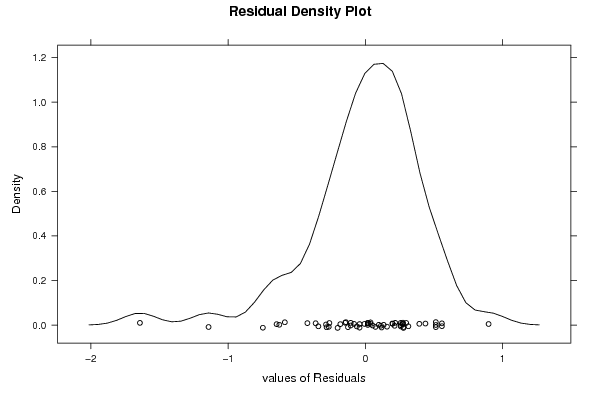
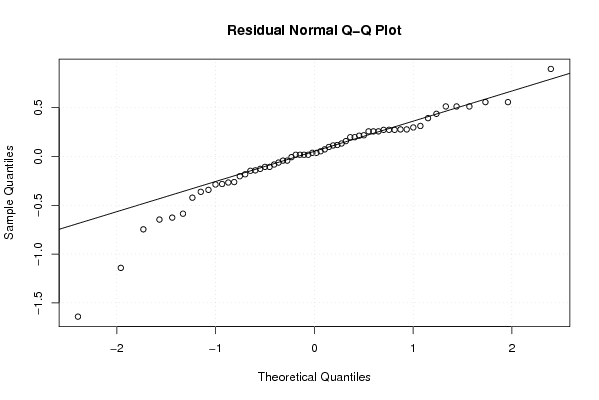
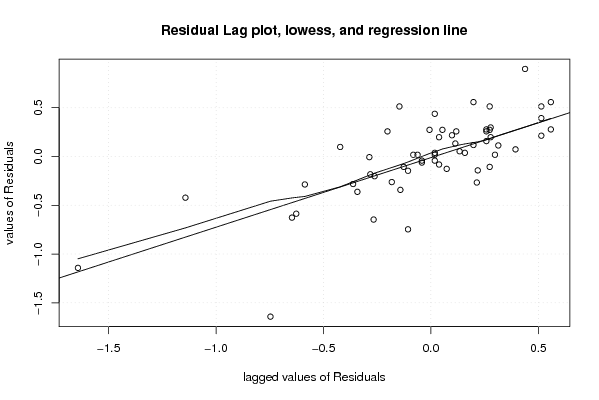
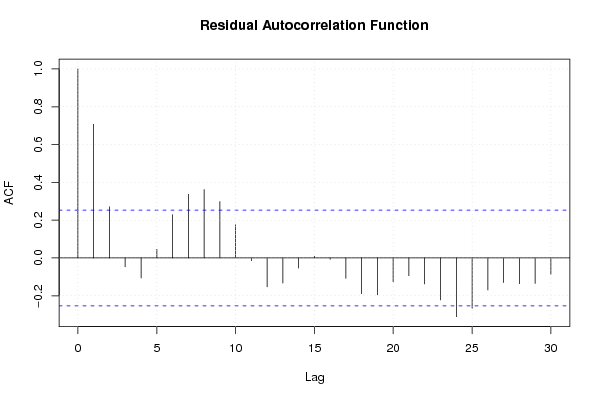
| Multiple Linear Regression - Residual Statistics | |
| Residual Standard Deviation | 0.465936612334712 |
| Sum Squared Residuals | 10.2035555555555 |
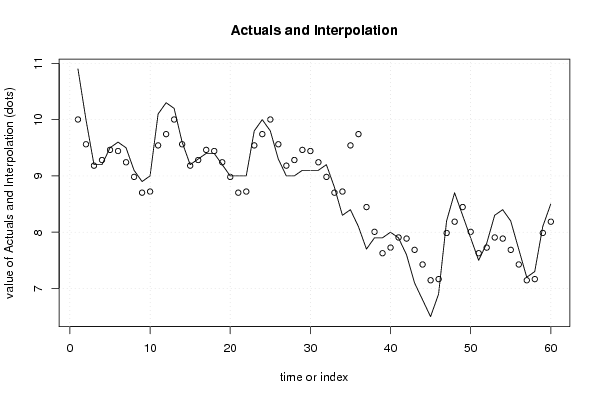
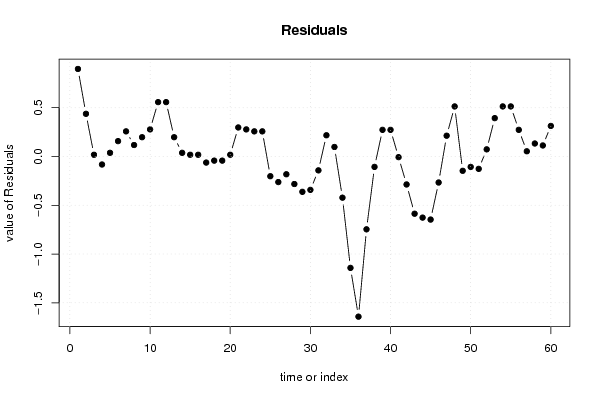
| Multiple Linear Regression - Actuals, Interpolation, and Residuals | |||
| Time or Index | Actuals | Interpolation Forecast | Residuals Prediction Error |
| 1 | 10.9 | 10.0022222222222 | 0.897777777777774 |
| 2 | 10 | 9.56222222222222 | 0.437777777777779 |
| 3 | 9.2 | 9.18222222222222 | 0.0177777777777778 |
| 4 | 9.2 | 9.28222222222222 | -0.0822222222222222 |
| 5 | 9.5 | 9.46222222222222 | 0.0377777777777778 |
| 6 | 9.6 | 9.44222222222222 | 0.157777777777778 |
| 7 | 9.5 | 9.24222222222222 | 0.257777777777778 |
| 8 | 9.1 | 8.98222222222222 | 0.117777777777777 |
| 9 | 8.9 | 8.70222222222222 | 0.197777777777778 |
| 10 | 9 | 8.72222222222222 | 0.277777777777778 |
| 11 | 10.1 | 9.54222222222222 | 0.557777777777778 |
| 12 | 10.3 | 9.74222222222222 | 0.557777777777778 |
| 13 | 10.2 | 10.0022222222222 | 0.197777777777778 |
| 14 | 9.6 | 9.56222222222222 | 0.0377777777777772 |
| 15 | 9.2 | 9.18222222222222 | 0.0177777777777771 |
| 16 | 9.3 | 9.28222222222222 | 0.0177777777777784 |
| 17 | 9.4 | 9.46222222222222 | -0.0622222222222221 |
| 18 | 9.4 | 9.44222222222222 | -0.042222222222222 |
| 19 | 9.2 | 9.24222222222222 | -0.0422222222222225 |
| 20 | 9 | 8.98222222222222 | 0.0177777777777782 |
| 21 | 9 | 8.70222222222222 | 0.297777777777777 |
| 22 | 9 | 8.72222222222222 | 0.277777777777778 |
| 23 | 9.8 | 9.54222222222222 | 0.257777777777778 |
| 24 | 10 | 9.74222222222222 | 0.257777777777777 |
| 25 | 9.8 | 10.0022222222222 | -0.202222222222221 |
| 26 | 9.3 | 9.56222222222222 | -0.262222222222222 |
| 27 | 9 | 9.18222222222222 | -0.182222222222222 |
| 28 | 9 | 9.28222222222222 | -0.282222222222222 |
| 29 | 9.1 | 9.46222222222222 | -0.362222222222223 |
| 30 | 9.1 | 9.44222222222222 | -0.342222222222222 |
| 31 | 9.1 | 9.24222222222222 | -0.142222222222222 |
| 32 | 9.2 | 8.98222222222222 | 0.217777777777777 |
| 33 | 8.8 | 8.70222222222222 | 0.097777777777778 |
| 34 | 8.3 | 8.72222222222222 | -0.422222222222222 |
| 35 | 8.4 | 9.54222222222222 | -1.14222222222222 |
| 36 | 8.1 | 9.74222222222222 | -1.64222222222222 |
| 37 | 7.7 | 8.44666666666667 | -0.746666666666666 |
| 38 | 7.9 | 8.00666666666667 | -0.106666666666667 |
| 39 | 7.9 | 7.62666666666667 | 0.273333333333334 |
| 40 | 8 | 7.72666666666667 | 0.273333333333333 |
| 41 | 7.9 | 7.90666666666667 | -0.00666666666666656 |
| 42 | 7.6 | 7.88666666666667 | -0.286666666666667 |
| 43 | 7.1 | 7.68666666666667 | -0.586666666666667 |
| 44 | 6.8 | 7.42666666666667 | -0.626666666666666 |
| 45 | 6.5 | 7.14666666666667 | -0.646666666666667 |
| 46 | 6.9 | 7.16666666666667 | -0.266666666666667 |
| 47 | 8.2 | 7.98666666666667 | 0.213333333333332 |
| 48 | 8.7 | 8.18666666666667 | 0.513333333333332 |
| 49 | 8.3 | 8.44666666666667 | -0.146666666666665 |
| 50 | 7.9 | 8.00666666666667 | -0.106666666666667 |
| 51 | 7.5 | 7.62666666666667 | -0.126666666666667 |
| 52 | 7.8 | 7.72666666666667 | 0.073333333333333 |
| 53 | 8.3 | 7.90666666666667 | 0.393333333333334 |
| 54 | 8.4 | 7.88666666666667 | 0.513333333333333 |
| 55 | 8.2 | 7.68666666666667 | 0.513333333333333 |
| 56 | 7.7 | 7.42666666666667 | 0.273333333333334 |
| 57 | 7.2 | 7.14666666666667 | 0.0533333333333332 |
| 58 | 7.3 | 7.16666666666667 | 0.133333333333333 |
| 59 | 8.1 | 7.98666666666667 | 0.113333333333333 |
| 60 | 8.5 | 8.18666666666667 | 0.313333333333333 |
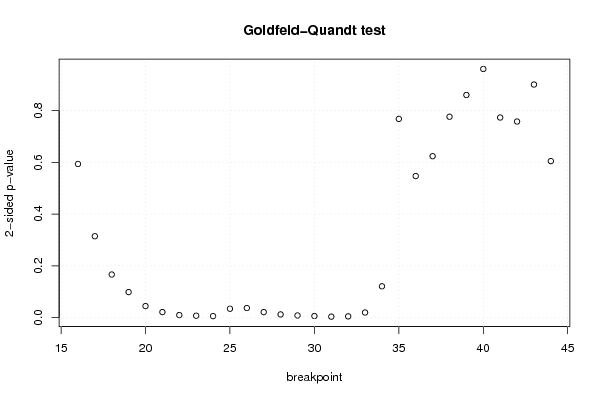
| Goldfeld-Quandt test for Heteroskedasticity | |||
| p-values | Alternative Hypothesis | ||
| breakpoint index | greater | 2-sided | less |
| 16 | 0.296795934498721 | 0.593591868997443 | 0.703204065501279 |
| 17 | 0.157223714595178 | 0.314447429190356 | 0.842776285404822 |
| 18 | 0.0832762897115845 | 0.166552579423169 | 0.916723710288415 |
| 19 | 0.0493058207308733 | 0.0986116414617466 | 0.950694179269127 |
| 20 | 0.0223113841723108 | 0.0446227683446216 | 0.97768861582769 |
| 21 | 0.0107371767169032 | 0.0214743534338064 | 0.989262823283097 |
| 22 | 0.00492995525732523 | 0.00985991051465047 | 0.995070044742675 |
| 23 | 0.00364665574174569 | 0.00729331148349138 | 0.996353344258254 |
| 24 | 0.00291428712782469 | 0.00582857425564938 | 0.997085712872175 |
| 25 | 0.0171368642807347 | 0.0342737285614693 | 0.982863135719265 |
| 26 | 0.0185023627501214 | 0.0370047255002428 | 0.981497637249879 |
| 27 | 0.0106660351132213 | 0.0213320702264426 | 0.989333964886779 |
| 28 | 0.00617719985943318 | 0.0123543997188664 | 0.993822800140567 |
| 29 | 0.00416471086765328 | 0.00832942173530657 | 0.995835289132347 |
| 30 | 0.00304849331772107 | 0.00609698663544213 | 0.99695150668228 |
| 31 | 0.00188902697749817 | 0.00377805395499633 | 0.998110973022502 |
| 32 | 0.00245889535961065 | 0.0049177907192213 | 0.99754110464039 |
| 33 | 0.00988674278497403 | 0.0197734855699481 | 0.990113257215026 |
| 34 | 0.0605196399718852 | 0.121039279943770 | 0.939480360028115 |
| 35 | 0.383818706174033 | 0.767637412348067 | 0.616181293825967 |
| 36 | 0.726581286625815 | 0.546837426748371 | 0.273418713374185 |
| 37 | 0.688176748787356 | 0.623646502425288 | 0.311823251212644 |
| 38 | 0.611986587153915 | 0.776026825692171 | 0.388013412846086 |
| 39 | 0.569965753270924 | 0.860068493458153 | 0.430034246729076 |
| 40 | 0.480333018036403 | 0.960666036072806 | 0.519666981963597 |
| 41 | 0.386507786179606 | 0.773015572359211 | 0.613492213820394 |
| 42 | 0.378783406159027 | 0.757566812318053 | 0.621216593840973 |
| 43 | 0.54977526315652 | 0.90044947368696 | 0.45022473684348 |
| 44 | 0.69769186437076 | 0.604616271258481 | 0.302308135629240 |
| Meta Analysis of Goldfeld-Quandt test for Heteroskedasticity | |||
| Description | # significant tests | % significant tests | OK/NOK |
| 1% type I error level | 7 | 0.241379310344828 | NOK |
| 5% type I error level | 14 | 0.482758620689655 | NOK |
| 10% type I error level | 15 | 0.517241379310345 | NOK |