| Multiple Linear Regression - Estimated Regression Equation |
| Werkl_Vrouwen[t] = + 7.38673263298069 + 0.4196382333358Werkl_Mannen[t] -0.10258803728638M1[t] -0.422645927350743M2[t] -0.724667640748687M3[t] -0.680973588814086M4[t] -0.607636124879781M5[t] -0.6419782496116M6[t] -0.77239272767626M7[t] -0.937628911740772M8[t] -1.08929403713842M9[t] -0.949351927202781M10[t] -0.252799992601909M11[t] -0.0360144632684767t + e[t] |
| Multiple Linear Regression - Ordinary Least Squares | |||||
| Variable | Parameter | S.D. | T-STAT H0: parameter = 0 | 2-tail p-value | 1-tail p-value |
| (Intercept) | 7.38673263298069 | 0.882223 | 8.3729 | 0 | 0 |
| Werkl_Mannen | 0.4196382333358 | 0.108377 | 3.872 | 0.000339 | 0.00017 |
| M1 | -0.10258803728638 | 0.294941 | -0.3478 | 0.729557 | 0.364779 |
| M2 | -0.422645927350743 | 0.297106 | -1.4225 | 0.161615 | 0.080807 |
| M3 | -0.724667640748687 | 0.298324 | -2.4291 | 0.0191 | 0.00955 |
| M4 | -0.680973588814086 | 0.294082 | -2.3156 | 0.025093 | 0.012546 |
| M5 | -0.607636124879781 | 0.292094 | -2.0803 | 0.043098 | 0.021549 |
| M6 | -0.6419782496116 | 0.292536 | -2.1945 | 0.033285 | 0.016642 |
| M7 | -0.77239272767626 | 0.291882 | -2.6462 | 0.011104 | 0.005552 |
| M8 | -0.937628911740772 | 0.291328 | -3.2185 | 0.002364 | 0.001182 |
| M9 | -1.08929403713842 | 0.291911 | -3.7316 | 0.000522 | 0.000261 |
| M10 | -0.949351927202781 | 0.293879 | -3.2304 | 0.002285 | 0.001143 |
| M11 | -0.252799992601909 | 0.29102 | -0.8687 | 0.389538 | 0.194769 |
| t | -0.0360144632684767 | 0.003953 | -9.1117 | 0 | 0 |
| Multiple Linear Regression - Regression Statistics | |
| Multiple R | 0.904201859845491 |
| R-squared | 0.817581003348045 |
| Adjusted R-squared | 0.766027808642058 |
| F-TEST (value) | 15.8589784398578 |
| F-TEST (DF numerator) | 13 |
| F-TEST (DF denominator) | 46 |
| p-value | 7.72271135929259e-13 |
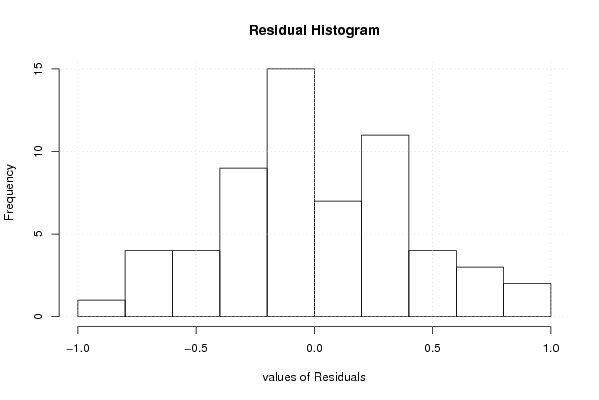
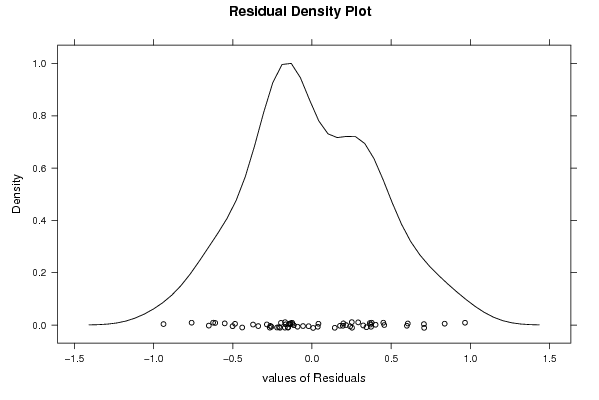
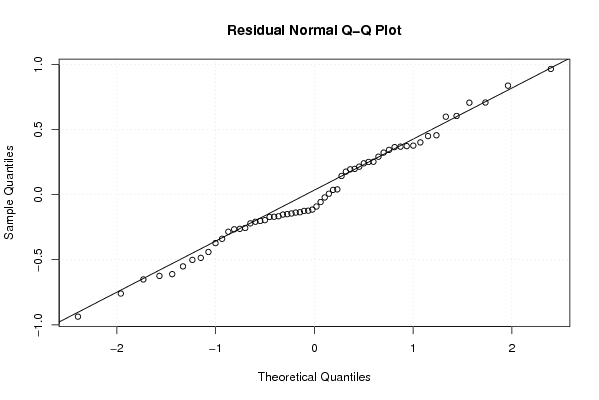
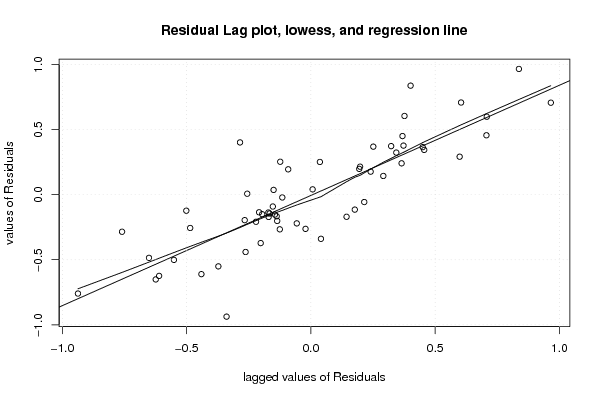
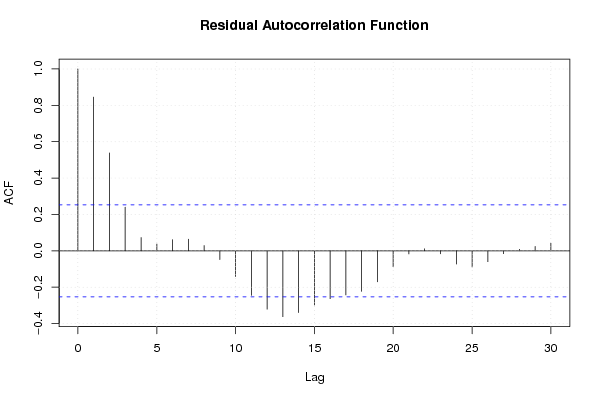
| Multiple Linear Regression - Residual Statistics | |
| Residual Standard Deviation | 0.460092760998810 |
| Sum Squared Residuals | 9.73752604128135 |
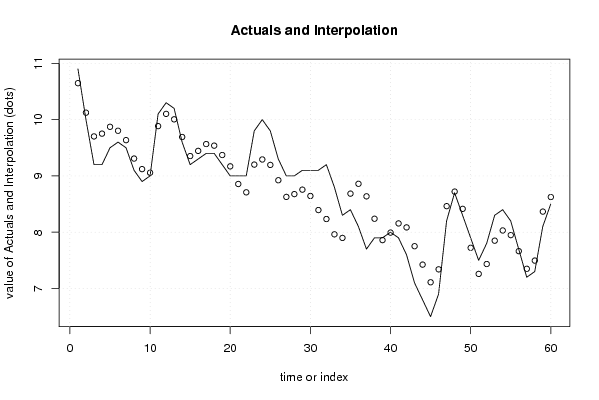
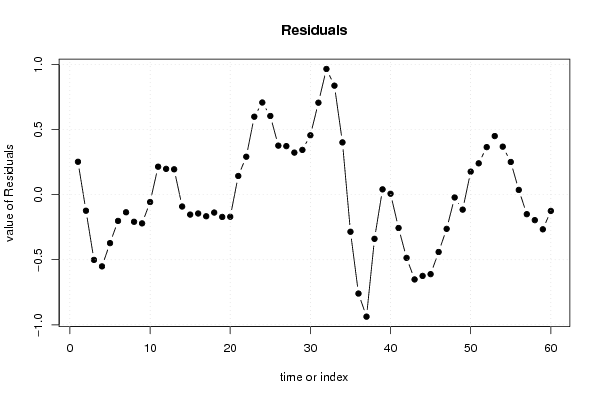
| Multiple Linear Regression - Actuals, Interpolation, and Residuals | |||
| Time or Index | Actuals | Interpolation Forecast | Residuals Prediction Error |
| 1 | 10.9 | 10.6471998224458 | 0.252800177554192 |
| 2 | 10 | 10.1232721757786 | -0.123272175778647 |
| 3 | 9.2 | 9.70130835244507 | -0.50130835244507 |
| 4 | 9.2 | 9.75095176444477 | -0.550951764444773 |
| 5 | 9.5 | 9.87220241177776 | -0.372202411777762 |
| 6 | 9.6 | 9.80184582377747 | -0.201845823777466 |
| 7 | 9.5 | 9.63541688244433 | -0.135416882444329 |
| 8 | 9.1 | 9.3082747651106 | -0.208274765110602 |
| 9 | 8.9 | 9.12059517644448 | -0.220595176444477 |
| 10 | 9 | 9.05666752977732 | -0.0566675297773168 |
| 11 | 10.1 | 9.88506029444403 | 0.214939705555966 |
| 12 | 10.3 | 10.1018458237775 | 0.198154176222535 |
| 13 | 10.2 | 10.0052071465562 | 0.19479285344381 |
| 14 | 9.6 | 9.69109861655693 | -0.0910986165569288 |
| 15 | 9.2 | 9.3530624398905 | -0.153062439890509 |
| 16 | 9.3 | 9.4446696752238 | -0.144669675223792 |
| 17 | 9.4 | 9.56592032255678 | -0.16592032255678 |
| 18 | 9.4 | 9.53752755789006 | -0.137527557890064 |
| 19 | 9.2 | 9.37109861655693 | -0.171098616556928 |
| 20 | 9 | 9.16984796922394 | -0.169847969223940 |
| 21 | 9 | 8.85627691055708 | 0.143723089442923 |
| 22 | 9 | 8.70842161722276 | 0.291578382777243 |
| 23 | 9.8 | 9.20110379522083 | 0.598896204779168 |
| 24 | 10 | 9.29199785455353 | 0.708002145446474 |
| 25 | 9.8 | 9.19535917733225 | 0.604640822667752 |
| 26 | 9.3 | 8.92321447066657 | 0.376785529333432 |
| 27 | 9 | 8.62714211733373 | 0.372857882666272 |
| 28 | 9 | 8.67678552933343 | 0.323214470666568 |
| 29 | 9.1 | 8.75607235333284 | 0.343927646667159 |
| 30 | 9.1 | 8.64375194199896 | 0.456248058001036 |
| 31 | 9.1 | 8.39339535399867 | 0.706604646001332 |
| 32 | 9.2 | 8.23410852999926 | 0.96589147000074 |
| 33 | 8.8 | 7.96250129466598 | 0.837498705334024 |
| 34 | 8.3 | 7.89857364799882 | 0.401426352001184 |
| 35 | 8.4 | 8.68500258933195 | -0.285002589331952 |
| 36 | 8.1 | 8.8598242953318 | -0.759824295331805 |
| 37 | 7.7 | 8.63729414810979 | -0.937294148109789 |
| 38 | 7.9 | 8.23925797144337 | -0.339257971443368 |
| 39 | 7.9 | 7.85925797144337 | 0.0407420285566328 |
| 40 | 8 | 7.99282903011023 | 0.00717096988976843 |
| 41 | 7.9 | 8.1560435007768 | -0.256043500776799 |
| 42 | 7.6 | 8.0856869127765 | -0.485686912776504 |
| 43 | 7.1 | 7.75140267810905 | -0.651402678109048 |
| 44 | 6.8 | 7.42426056077532 | -0.62426056077532 |
| 45 | 6.5 | 7.11068950210846 | -0.610689502108456 |
| 46 | 6.9 | 7.34050861877636 | -0.440508618776356 |
| 47 | 8.2 | 8.46264814677813 | -0.262648146778132 |
| 48 | 8.7 | 8.72139749944514 | -0.0213974994451436 |
| 49 | 8.3 | 8.41493970555597 | -0.114939705555966 |
| 50 | 7.9 | 7.72315676555449 | 0.176843234445513 |
| 51 | 7.5 | 7.25922911888733 | 0.240770881112673 |
| 52 | 7.8 | 7.43476400088777 | 0.365235999112229 |
| 53 | 8.3 | 7.84976141155582 | 0.450238588444182 |
| 54 | 8.4 | 8.031187763557 | 0.368812236442998 |
| 55 | 8.2 | 7.94868646889103 | 0.251313531108973 |
| 56 | 7.7 | 7.66350817489088 | 0.0364918251091230 |
| 57 | 7.2 | 7.34993711622401 | -0.149937116224014 |
| 58 | 7.3 | 7.49582858622475 | -0.195828586224754 |
| 59 | 8.1 | 8.36618517422505 | -0.26618517422505 |
| 60 | 8.5 | 8.62493452689206 | -0.124934526892061 |
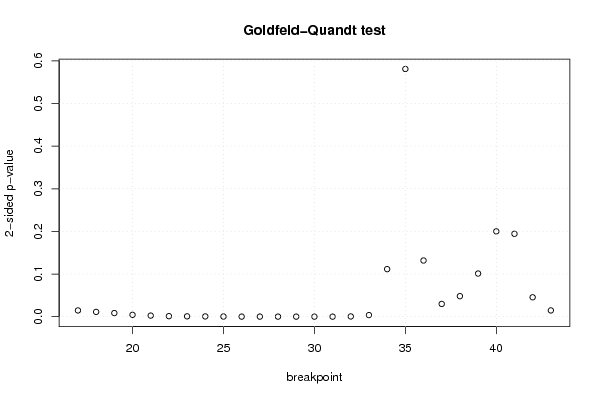
| Goldfeld-Quandt test for Heteroskedasticity | |||
| p-values | Alternative Hypothesis | ||
| breakpoint index | greater | 2-sided | less |
| 17 | 0.00730236631593619 | 0.0146047326318724 | 0.992697633684064 |
| 18 | 0.00558196564698079 | 0.0111639312939616 | 0.99441803435302 |
| 19 | 0.00421079582555247 | 0.00842159165110495 | 0.995789204174448 |
| 20 | 0.00216226129454762 | 0.00432452258909523 | 0.997837738705452 |
| 21 | 0.00123579162805974 | 0.00247158325611948 | 0.99876420837194 |
| 22 | 0.0005752570758167 | 0.0011505141516334 | 0.999424742924183 |
| 23 | 0.000363186087516210 | 0.000726372175032419 | 0.999636813912484 |
| 24 | 0.000292905158009509 | 0.000585810316019017 | 0.99970709484199 |
| 25 | 0.000154651226420498 | 0.000309302452840996 | 0.99984534877358 |
| 26 | 4.75697262196118e-05 | 9.51394524392236e-05 | 0.99995243027378 |
| 27 | 5.93322587777853e-05 | 0.000118664517555571 | 0.999940667741222 |
| 28 | 4.95175949780294e-05 | 9.90351899560588e-05 | 0.999950482405022 |
| 29 | 1.99749660869559e-05 | 3.99499321739117e-05 | 0.999980025033913 |
| 30 | 6.26152881613905e-06 | 1.25230576322781e-05 | 0.999993738471184 |
| 31 | 7.78773661908973e-06 | 1.55754732381795e-05 | 0.99999221226338 |
| 32 | 0.000252129175434248 | 0.000504258350868497 | 0.999747870824566 |
| 33 | 0.00185876586830969 | 0.00371753173661938 | 0.99814123413169 |
| 34 | 0.0557231348710124 | 0.111446269742025 | 0.944276865128988 |
| 35 | 0.70949905529625 | 0.5810018894075 | 0.29050094470375 |
| 36 | 0.934143729408794 | 0.131712541182412 | 0.0658562705912062 |
| 37 | 0.985089486888441 | 0.0298210262231174 | 0.0149105131115587 |
| 38 | 0.975983400952765 | 0.0480331980944704 | 0.0240165990472352 |
| 39 | 0.949433076178772 | 0.101133847642456 | 0.0505669238212278 |
| 40 | 0.899978058192927 | 0.200043883614146 | 0.100021941807073 |
| 41 | 0.902825530240147 | 0.194348939519706 | 0.0971744697598529 |
| 42 | 0.977295320584494 | 0.0454093588310114 | 0.0227046794155057 |
| 43 | 0.992680902802453 | 0.014638194395095 | 0.0073190971975475 |
| Meta Analysis of Goldfeld-Quandt test for Heteroskedasticity | |||
| Description | # significant tests | % significant tests | OK/NOK |
| 1% type I error level | 15 | 0.555555555555556 | NOK |
| 5% type I error level | 21 | 0.777777777777778 | NOK |
| 10% type I error level | 21 | 0.777777777777778 | NOK |