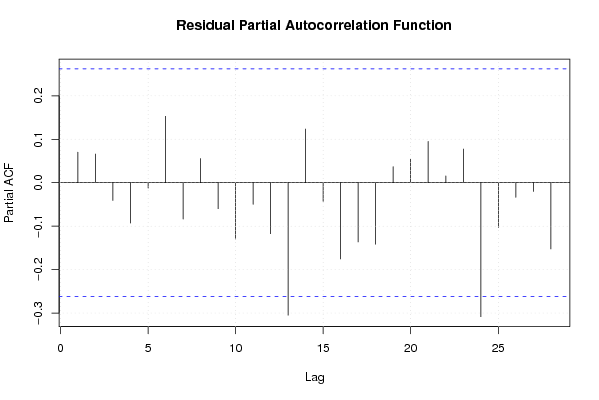
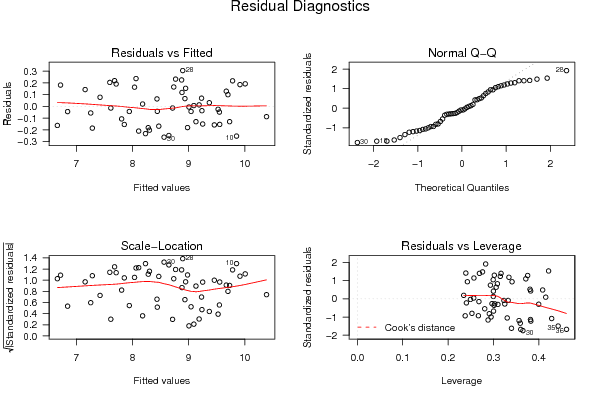
| Multiple Linear Regression - Estimated Regression Equation |
| Y[t][t] = + 0.896550866003112 + 0.0673089460667498`X[t]`[t] + 1.40499954314054Y1[t] -0.52400110570065Y2[t] -0.374098836785457Y3[t] + 0.366078798454609Y4[t] -0.223823163888711M1[t] -0.429401490852397M2[t] -0.320995317768826M3[t] -0.266240827611457M4[t] -0.340227919439894M5[t] -0.113023296599354M6[t] + 0.486610505980998M7[t] -0.457802485721289M8[t] -0.434078057541609M9[t] + 0.0287063053531581M10[t] -0.170539719028066M11[t] -0.00408144041800594t + e[t] |
| Multiple Linear Regression - Ordinary Least Squares | |||||
| Variable | Parameter | S.D. | T-STAT H0: parameter = 0 | 2-tail p-value | 1-tail p-value |
| (Intercept) | 0.896550866003112 | 0.696565 | 1.2871 | 0.205843 | 0.102922 |
| `X[t]` | 0.0673089460667498 | 0.051976 | 1.295 | 0.203136 | 0.101568 |
| Y1 | 1.40499954314054 | 0.156182 | 8.9959 | 0 | 0 |
| Y2 | -0.52400110570065 | 0.275272 | -1.9036 | 0.064559 | 0.03228 |
| Y3 | -0.374098836785457 | 0.272264 | -1.374 | 0.177483 | 0.088742 |
| Y4 | 0.366078798454609 | 0.145139 | 2.5223 | 0.015969 | 0.007985 |
| M1 | -0.223823163888711 | 0.136939 | -1.6345 | 0.110417 | 0.055209 |
| M2 | -0.429401490852397 | 0.141424 | -3.0363 | 0.004311 | 0.002155 |
| M3 | -0.320995317768826 | 0.140445 | -2.2856 | 0.027948 | 0.013974 |
| M4 | -0.266240827611457 | 0.139002 | -1.9154 | 0.062993 | 0.031497 |
| M5 | -0.340227919439894 | 0.131747 | -2.5824 | 0.013788 | 0.006894 |
| M6 | -0.113023296599354 | 0.129688 | -0.8715 | 0.388952 | 0.194476 |
| M7 | 0.486610505980998 | 0.135915 | 3.5803 | 0.000959 | 0.00048 |
| M8 | -0.457802485721289 | 0.179057 | -2.5567 | 0.014683 | 0.007342 |
| M9 | -0.434078057541609 | 0.191835 | -2.2628 | 0.029448 | 0.014724 |
| M10 | 0.0287063053531581 | 0.17802 | 0.1613 | 0.872748 | 0.436374 |
| M11 | -0.170539719028066 | 0.142509 | -1.1967 | 0.238838 | 0.119419 |
| t | -0.00408144041800594 | 0.003494 | -1.1682 | 0.250008 | 0.125004 |
| Multiple Linear Regression - Regression Statistics | |
| Multiple R | 0.985302965025289 |
| R-squared | 0.970821932887626 |
| Adjusted R-squared | 0.957768587074195 |
| F-TEST (value) | 74.3734171118595 |
| F-TEST (DF numerator) | 17 |
| F-TEST (DF denominator) | 38 |
| p-value | 0 |
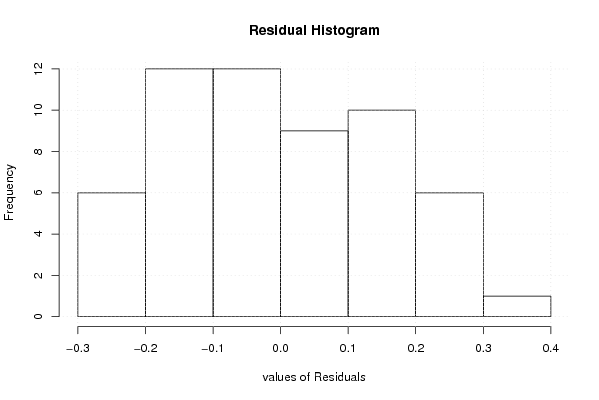
| Multiple Linear Regression - Residual Statistics | |
| Residual Standard Deviation | 0.187914623193336 |
| Sum Squared Residuals | 1.34185241317596 |
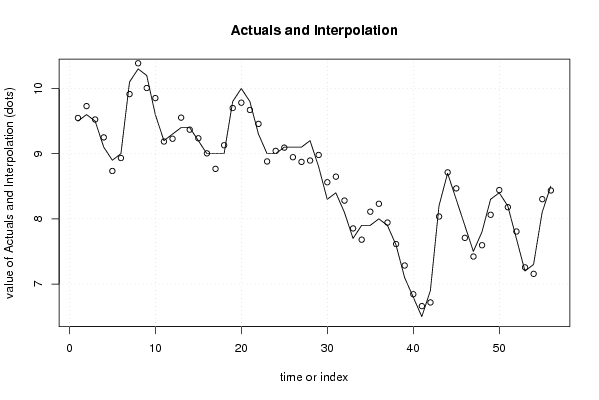
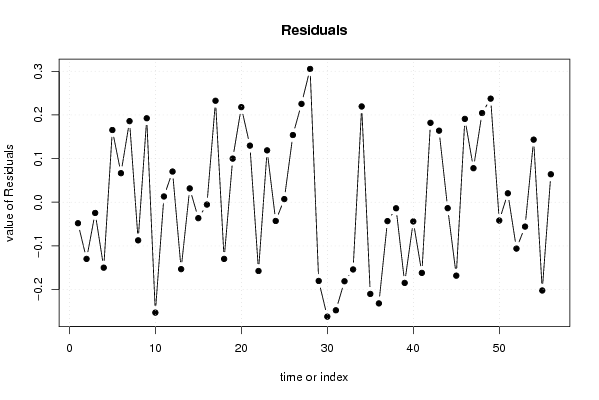
| Multiple Linear Regression - Actuals, Interpolation, and Residuals | |||
| Time or Index | Actuals | Interpolation Forecast | Residuals Prediction Error |
| 1 | 9.5 | 9.54811220076473 | -0.0481122007647298 |
| 2 | 9.6 | 9.72976044714444 | -0.129760447144436 |
| 3 | 9.5 | 9.52452176365017 | -0.0245217636501714 |
| 4 | 9.1 | 9.24987241364975 | -0.149872413649753 |
| 5 | 8.9 | 8.734617930575 | 0.165382069425006 |
| 6 | 9 | 8.93343583174699 | 0.0665641682530137 |
| 7 | 10.1 | 9.91424360265894 | 0.185756397341062 |
| 8 | 10.3 | 10.3872368053984 | -0.0872368053984253 |
| 9 | 10.2 | 10.0075837367547 | 0.192416263245295 |
| 10 | 9.6 | 9.85281653776541 | -0.252816537765412 |
| 11 | 9.2 | 9.1867563685949 | 0.0132436314050998 |
| 12 | 9.3 | 9.22970292595195 | 0.0702970740480514 |
| 13 | 9.4 | 9.55321192967871 | -0.153211929678711 |
| 14 | 9.4 | 9.3683751562891 | 0.0316248437109006 |
| 15 | 9.2 | 9.23645837532421 | -0.0364583753242111 |
| 16 | 9 | 9.00532951260238 | -0.00532951260237865 |
| 17 | 9 | 8.7674764888934 | 0.232523511106605 |
| 18 | 9 | 9.1298342921731 | -0.1298342921731 |
| 19 | 9.8 | 9.70006708357491 | 0.0999329164250862 |
| 20 | 10 | 9.78216384245611 | 0.217836157543888 |
| 21 | 9.8 | 9.67033674889205 | 0.129663251107952 |
| 22 | 9.3 | 9.45742226138556 | -0.157422261385556 |
| 23 | 9 | 8.88116941216946 | 0.118830587830545 |
| 24 | 9 | 9.04289480234236 | -0.0428948023423637 |
| 25 | 9.1 | 9.09275508305432 | 0.00724491694567558 |
| 26 | 9.1 | 8.94605462718834 | 0.153945372811657 |
| 27 | 9.1 | 8.87469382053411 | 0.225306179465889 |
| 28 | 9.2 | 8.8946878812016 | 0.305312118798396 |
| 29 | 8.8 | 8.98026539390133 | -0.180265393901325 |
| 30 | 8.3 | 8.56206507007088 | -0.262065070070878 |
| 31 | 8.4 | 8.64750090308469 | -0.24750090308469 |
| 32 | 8.1 | 8.28102349808174 | -0.181023498081745 |
| 33 | 7.7 | 7.85392262212873 | -0.153922622128725 |
| 34 | 7.9 | 7.68064588154694 | 0.219354118453061 |
| 35 | 7.9 | 8.1100254039305 | -0.210025403930501 |
| 36 | 8 | 8.23169204039826 | -0.231692040398255 |
| 37 | 7.9 | 7.94322878748668 | -0.0432287874866822 |
| 38 | 7.6 | 7.6138847149118 | -0.0138847149117937 |
| 39 | 7.1 | 7.28477623310001 | -0.184776233100014 |
| 40 | 6.8 | 6.84397492268328 | -0.0439749226832812 |
| 41 | 6.5 | 6.66183616771515 | -0.161836167715152 |
| 42 | 6.9 | 6.71807828158209 | 0.181921718417913 |
| 43 | 8.2 | 8.0360608851926 | 0.163939114807396 |
| 44 | 8.7 | 8.71360232298069 | -0.0136023229806874 |
| 45 | 8.3 | 8.46815689222452 | -0.168156892224523 |
| 46 | 7.9 | 7.7091153193021 | 0.190884680697906 |
| 47 | 7.5 | 7.42204881530514 | 0.0779511846948565 |
| 48 | 7.8 | 7.59571023130743 | 0.204289768692568 |
| 49 | 8.3 | 8.06269199901555 | 0.237308000984447 |
| 50 | 8.4 | 8.44192505446633 | -0.0419250544663281 |
| 51 | 8.2 | 8.1795498073915 | 0.0204501926085077 |
| 52 | 7.7 | 7.80613526986298 | -0.106135269862983 |
| 53 | 7.2 | 7.25580401891513 | -0.0558040189151345 |
| 54 | 7.3 | 7.15658652442695 | 0.143413475573052 |
| 55 | 8.1 | 8.30212752548885 | -0.202127525488854 |
| 56 | 8.5 | 8.43597353108303 | 0.0640264689169696 |
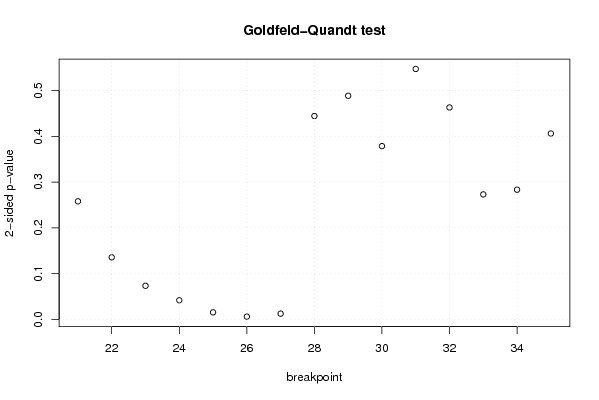
| Goldfeld-Quandt test for Heteroskedasticity | |||
| p-values | Alternative Hypothesis | ||
| breakpoint index | greater | 2-sided | less |
| 21 | 0.128972209923009 | 0.257944419846019 | 0.87102779007699 |
| 22 | 0.0677485936852214 | 0.135497187370443 | 0.932251406314779 |
| 23 | 0.0366932996967069 | 0.0733865993934138 | 0.963306700303293 |
| 24 | 0.0208611640694361 | 0.0417223281388721 | 0.979138835930564 |
| 25 | 0.00765372561380247 | 0.0153074512276049 | 0.992346274386197 |
| 26 | 0.00295105054371247 | 0.00590210108742495 | 0.997048949456288 |
| 27 | 0.00621527802386244 | 0.0124305560477249 | 0.993784721976138 |
| 28 | 0.222176822473349 | 0.444353644946699 | 0.77782317752665 |
| 29 | 0.244266937499125 | 0.488533874998249 | 0.755733062500875 |
| 30 | 0.189297328449588 | 0.378594656899176 | 0.810702671550412 |
| 31 | 0.726418359696651 | 0.547163280606698 | 0.273581640303349 |
| 32 | 0.768478472075714 | 0.463043055848572 | 0.231521527924286 |
| 33 | 0.863494842631606 | 0.273010314736788 | 0.136505157368394 |
| 34 | 0.858323829590447 | 0.283352340819107 | 0.141676170409553 |
| 35 | 0.796954891427427 | 0.406090217145146 | 0.203045108572573 |
| Meta Analysis of Goldfeld-Quandt test for Heteroskedasticity | |||
| Description | # significant tests | % significant tests | OK/NOK |
| 1% type I error level | 1 | 0.0666666666666667 | NOK |
| 5% type I error level | 4 | 0.266666666666667 | NOK |
| 10% type I error level | 5 | 0.333333333333333 | NOK |