| Multiple Linear Regression - Estimated Regression Equation |
| CPItot[t] = + 121.12 -1.02727272727274CPIlandbouw[t] -1.80909090909093M1[t] -1.41818181818181M2[t] -2.20363636363636M3[t] -1.15272727272726M4[t] -1.22363636363636M5[t] -1.0690909090909M6[t] -0.47818181818181M7[t] -0.543636363636355M8[t] -0.31272727272726M9[t] -1.38M10[t] + 0.476363636363643M11[t] + e[t] |
| Multiple Linear Regression - Ordinary Least Squares | |||||
| Variable | Parameter | S.D. | T-STAT H0: parameter = 0 | 2-tail p-value | 1-tail p-value |
| (Intercept) | 121.12 | 1.937919 | 62.5 | 0 | 0 |
| CPIlandbouw | -1.02727272727274 | 1.460761 | -0.7032 | 0.485372 | 0.242686 |
| M1 | -1.80909090909093 | 2.802226 | -0.6456 | 0.521684 | 0.260842 |
| M2 | -1.41818181818181 | 2.97938 | -0.476 | 0.63628 | 0.31814 |
| M3 | -2.20363636363636 | 2.877366 | -0.7659 | 0.447594 | 0.223797 |
| M4 | -1.15272727272726 | 3.105621 | -0.3712 | 0.712176 | 0.356088 |
| M5 | -1.22363636363636 | 2.877366 | -0.4253 | 0.672586 | 0.336293 |
| M6 | -1.0690909090909 | 2.802226 | -0.3815 | 0.704541 | 0.35227 |
| M7 | -0.47818181818181 | 2.97938 | -0.1605 | 0.873177 | 0.436589 |
| M8 | -0.543636363636355 | 2.877366 | -0.1889 | 0.850957 | 0.425478 |
| M9 | -0.31272727272726 | 3.105621 | -0.1007 | 0.920219 | 0.46011 |
| M10 | -1.38 | 2.740631 | -0.5035 | 0.616941 | 0.308471 |
| M11 | 0.476363636363643 | 2.877366 | 0.1656 | 0.869217 | 0.434608 |
| Multiple Linear Regression - Regression Statistics | |
| Multiple R | 0.226426138076746 |
| R-squared | 0.0512687960043497 |
| Adjusted R-squared | -0.190960447569008 |
| F-TEST (value) | 0.211654031726451 |
| F-TEST (DF numerator) | 12 |
| F-TEST (DF denominator) | 47 |
| p-value | 0.997170235499864 |
| Multiple Linear Regression - Residual Statistics | |
| Residual Standard Deviation | 4.33331835537758 |
| Sum Squared Residuals | 882.549454545456 |
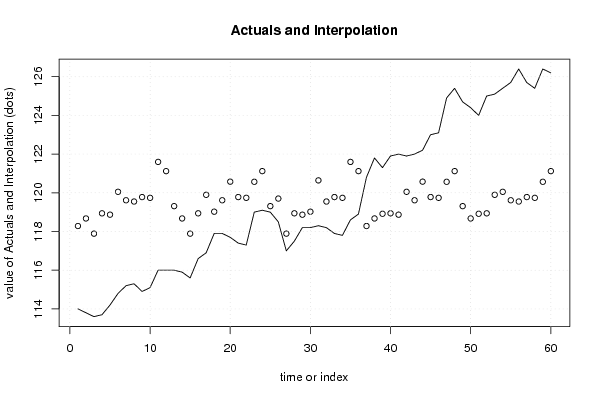
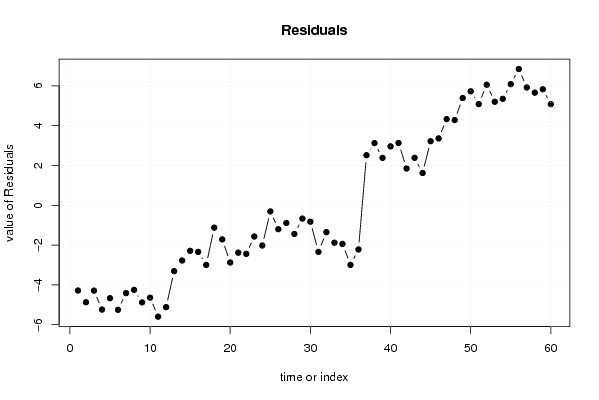
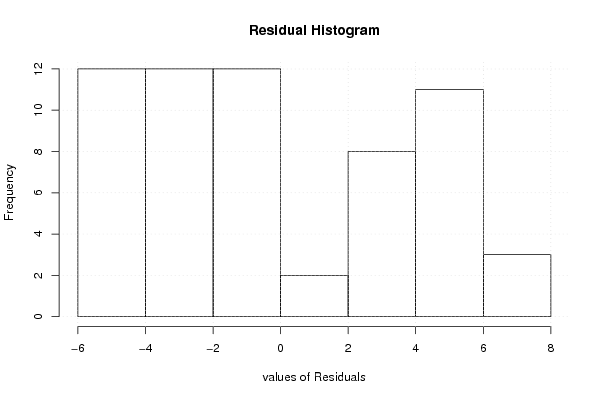
| Multiple Linear Regression - Actuals, Interpolation, and Residuals | |||
| Time or Index | Actuals | Interpolation Forecast | Residuals Prediction Error |
| 1 | 114 | 118.283636363636 | -4.28363636363644 |
| 2 | 113.8 | 118.674545454545 | -4.87454545454545 |
| 3 | 113.6 | 117.889090909091 | -4.2890909090909 |
| 4 | 113.7 | 118.94 | -5.24 |
| 5 | 114.2 | 118.869090909091 | -4.6690909090909 |
| 6 | 114.8 | 120.050909090909 | -5.25090909090911 |
| 7 | 115.2 | 119.614545454545 | -4.41454545454545 |
| 8 | 115.3 | 119.549090909091 | -4.24909090909091 |
| 9 | 114.9 | 119.78 | -4.88 |
| 10 | 115.1 | 119.74 | -4.64000000000001 |
| 11 | 116 | 121.596363636364 | -5.59636363636364 |
| 12 | 116 | 121.12 | -5.12 |
| 13 | 116 | 119.310909090909 | -3.31090909090908 |
| 14 | 115.9 | 118.674545454545 | -2.77454545454545 |
| 15 | 115.6 | 117.889090909091 | -2.28909090909091 |
| 16 | 116.6 | 118.94 | -2.34000000000001 |
| 17 | 116.9 | 119.896363636364 | -2.99636363636364 |
| 18 | 117.9 | 119.023636363636 | -1.12363636363636 |
| 19 | 117.9 | 119.614545454545 | -1.71454545454545 |
| 20 | 117.7 | 120.576363636364 | -2.87636363636364 |
| 21 | 117.4 | 119.78 | -2.38 |
| 22 | 117.3 | 119.74 | -2.44000000000000 |
| 23 | 119 | 120.569090909091 | -1.56909090909091 |
| 24 | 119.1 | 121.12 | -2.02000000000000 |
| 25 | 119 | 119.310909090909 | -0.310909090909073 |
| 26 | 118.5 | 119.701818181818 | -1.20181818181819 |
| 27 | 117 | 117.889090909091 | -0.889090909090904 |
| 28 | 117.5 | 118.94 | -1.44000000000000 |
| 29 | 118.2 | 118.869090909091 | -0.669090909090905 |
| 30 | 118.2 | 119.023636363636 | -0.82363636363636 |
| 31 | 118.3 | 120.641818181818 | -2.34181818181819 |
| 32 | 118.2 | 119.549090909091 | -1.34909090909090 |
| 33 | 117.9 | 119.78 | -1.88 |
| 34 | 117.8 | 119.74 | -1.94000000000000 |
| 35 | 118.6 | 121.596363636364 | -2.99636363636365 |
| 36 | 118.9 | 121.12 | -2.21999999999999 |
| 37 | 120.8 | 118.283636363636 | 2.51636363636366 |
| 38 | 121.8 | 118.674545454545 | 3.12545454545455 |
| 39 | 121.3 | 118.916363636364 | 2.38363636363636 |
| 40 | 121.9 | 118.94 | 2.96000000000000 |
| 41 | 122 | 118.869090909091 | 3.13090909090909 |
| 42 | 121.9 | 120.050909090909 | 1.84909090909091 |
| 43 | 122 | 119.614545454545 | 2.38545454545455 |
| 44 | 122.2 | 120.576363636364 | 1.62363636363636 |
| 45 | 123 | 119.78 | 3.22000000000000 |
| 46 | 123.1 | 119.74 | 3.35999999999999 |
| 47 | 124.9 | 120.569090909091 | 4.3309090909091 |
| 48 | 125.4 | 121.12 | 4.28000000000001 |
| 49 | 124.7 | 119.310909090909 | 5.38909090909093 |
| 50 | 124.4 | 118.674545454545 | 5.72545454545455 |
| 51 | 124 | 118.916363636364 | 5.08363636363636 |
| 52 | 125 | 118.94 | 6.06 |
| 53 | 125.1 | 119.896363636364 | 5.20363636363635 |
| 54 | 125.4 | 120.050909090909 | 5.34909090909091 |
| 55 | 125.7 | 119.614545454545 | 6.08545454545455 |
| 56 | 126.4 | 119.549090909091 | 6.8509090909091 |
| 57 | 125.7 | 119.78 | 5.92 |
| 58 | 125.4 | 119.74 | 5.66000000000001 |
| 59 | 126.4 | 120.569090909091 | 5.8309090909091 |
| 60 | 126.2 | 121.12 | 5.08000000000001 |
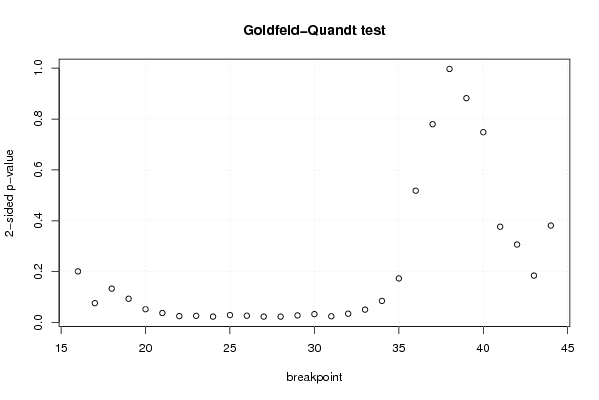
| Goldfeld-Quandt test for Heteroskedasticity | |||
| p-values | Alternative Hypothesis | ||
| breakpoint index | greater | 2-sided | less |
| 16 | 0.100547587614722 | 0.201095175229445 | 0.899452412385278 |
| 17 | 0.0380663931256433 | 0.0761327862512867 | 0.961933606874357 |
| 18 | 0.0666291685949199 | 0.133258337189840 | 0.93337083140508 |
| 19 | 0.0466789041028267 | 0.0933578082056533 | 0.953321095897173 |
| 20 | 0.0261095034003548 | 0.0522190068007096 | 0.973890496599645 |
| 21 | 0.0186283265025068 | 0.0372566530050136 | 0.981371673497493 |
| 22 | 0.0125622495801014 | 0.0251244991602028 | 0.987437750419899 |
| 23 | 0.0131255832336783 | 0.0262511664673565 | 0.986874416766322 |
| 24 | 0.0115729077556159 | 0.0231458155112317 | 0.988427092244384 |
| 25 | 0.0146041753393795 | 0.0292083506787591 | 0.98539582466062 |
| 26 | 0.0133268469391413 | 0.0266536938782825 | 0.986673153060859 |
| 27 | 0.0116061167549792 | 0.0232122335099585 | 0.98839388324502 |
| 28 | 0.0114959582916885 | 0.022991916583377 | 0.988504041708312 |
| 29 | 0.0139351467129258 | 0.0278702934258517 | 0.986064853287074 |
| 30 | 0.0164694538862224 | 0.0329389077724449 | 0.983530546113778 |
| 31 | 0.0122307307407537 | 0.0244614614815074 | 0.987769269259246 |
| 32 | 0.0172843215493617 | 0.0345686430987234 | 0.982715678450638 |
| 33 | 0.0252795539956810 | 0.0505591079913619 | 0.97472044600432 |
| 34 | 0.0424634759807013 | 0.0849269519614025 | 0.957536524019299 |
| 35 | 0.086707417768969 | 0.173414835537938 | 0.913292582231031 |
| 36 | 0.259091449689726 | 0.518182899379453 | 0.740908550310273 |
| 37 | 0.389740635101265 | 0.779481270202531 | 0.610259364898735 |
| 38 | 0.498423578301869 | 0.996847156603738 | 0.501576421698131 |
| 39 | 0.559023591391972 | 0.881952817216055 | 0.440976408608028 |
| 40 | 0.625881129585552 | 0.748237740828897 | 0.374118870414448 |
| 41 | 0.811735810703998 | 0.376528378592003 | 0.188264189296002 |
| 42 | 0.846754310817758 | 0.306491378364484 | 0.153245689182242 |
| 43 | 0.907807953950998 | 0.184384092098005 | 0.0921920460490023 |
| 44 | 0.809440252719386 | 0.381119494561229 | 0.190559747280614 |
| Meta Analysis of Goldfeld-Quandt test for Heteroskedasticity | |||
| Description | # significant tests | % significant tests | OK/NOK |
| 1% type I error level | 0 | 0 | OK |
| 5% type I error level | 12 | 0.413793103448276 | NOK |
| 10% type I error level | 17 | 0.586206896551724 | NOK |