| Multiple Linear Regression - Estimated Regression Equation |
| Yt[t] = + 3.44967554333794 + 0.345771119866665`Yt-1`[t] + 0.572393185503651`Yt-2`[t] + 0.329280609238653`Yt-3`[t] -0.284562624705873`Yt-4`[t] -8.40904074349483M1[t] -6.16791229568818M2[t] + 6.13035172360855M3[t] + 24.5480317538756M4[t] + 2.83995158796344M5[t] -7.88662923258578M6[t] + 18.9911058720556M7[t] -18.0391515918807M8[t] -29.8249609435041M9[t] + 22.5604543650976M10[t] + 32.1620988449328M11[t] -0.0850084829355323t + e[t] |
| Multiple Linear Regression - Ordinary Least Squares | |||||
| Variable | Parameter | S.D. | T-STAT H0: parameter = 0 | 2-tail p-value | 1-tail p-value |
| (Intercept) | 3.44967554333794 | 11.4355 | 0.3017 | 0.764511 | 0.382256 |
| `Yt-1` | 0.345771119866665 | 0.160954 | 2.1483 | 0.037961 | 0.018981 |
| `Yt-2` | 0.572393185503651 | 0.158911 | 3.602 | 0.000882 | 0.000441 |
| `Yt-3` | 0.329280609238653 | 0.174203 | 1.8902 | 0.066177 | 0.033089 |
| `Yt-4` | -0.284562624705873 | 0.184055 | -1.5461 | 0.130164 | 0.065082 |
| M1 | -8.40904074349483 | 8.040222 | -1.0459 | 0.302059 | 0.15103 |
| M2 | -6.16791229568818 | 9.297597 | -0.6634 | 0.510985 | 0.255492 |
| M3 | 6.13035172360855 | 9.17902 | 0.6679 | 0.508153 | 0.254076 |
| M4 | 24.5480317538756 | 8.843882 | 2.7757 | 0.008416 | 0.004208 |
| M5 | 2.83995158796344 | 6.663897 | 0.4262 | 0.672327 | 0.336164 |
| M6 | -7.88662923258578 | 6.466877 | -1.2195 | 0.229963 | 0.114981 |
| M7 | 18.9911058720556 | 9.53939 | 1.9908 | 0.053542 | 0.026771 |
| M8 | -18.0391515918807 | 8.38865 | -2.1504 | 0.037779 | 0.01889 |
| M9 | -29.8249609435041 | 9.960682 | -2.9943 | 0.004759 | 0.002379 |
| M10 | 22.5604543650976 | 14.949974 | 1.5091 | 0.139342 | 0.069671 |
| M11 | 32.1620988449328 | 12.126634 | 2.6522 | 0.011504 | 0.005752 |
| t | -0.0850084829355323 | 0.08498 | -1.0003 | 0.323314 | 0.161657 |
| Multiple Linear Regression - Regression Statistics | |
| Multiple R | 0.937994052362038 |
| R-squared | 0.879832842266557 |
| Adjusted R-squared | 0.830533495504119 |
| F-TEST (value) | 17.8467444306364 |
| F-TEST (DF numerator) | 16 |
| F-TEST (DF denominator) | 39 |
| p-value | 3.72590847064203e-13 |
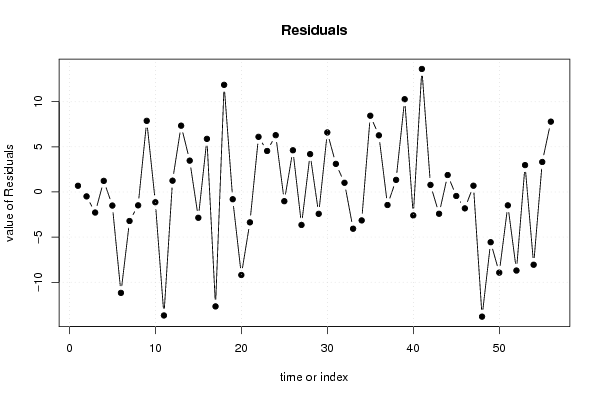
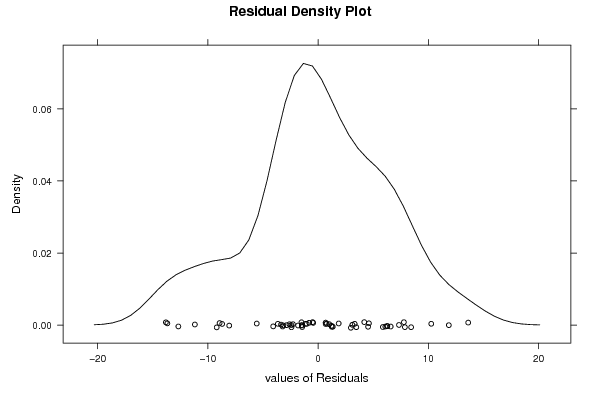
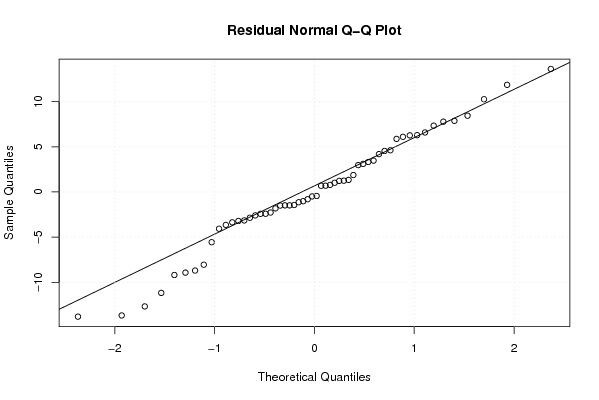
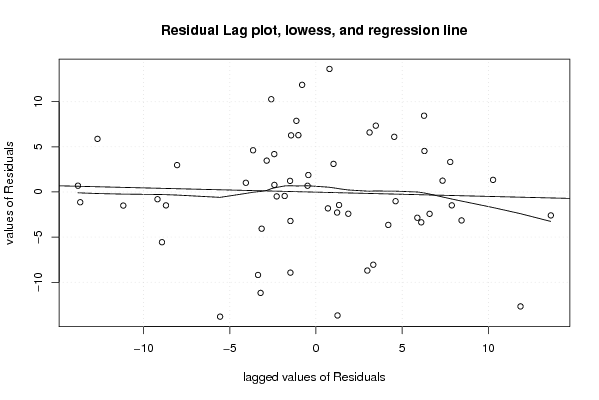
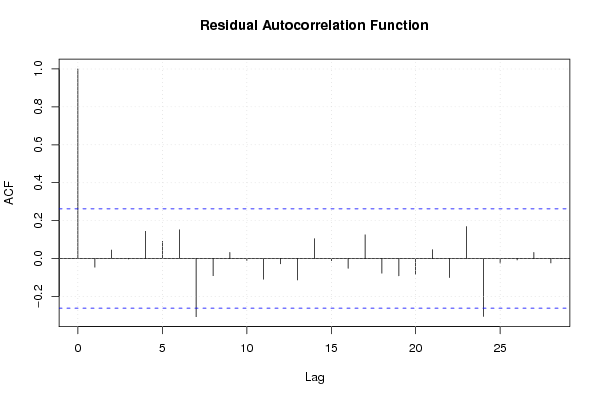
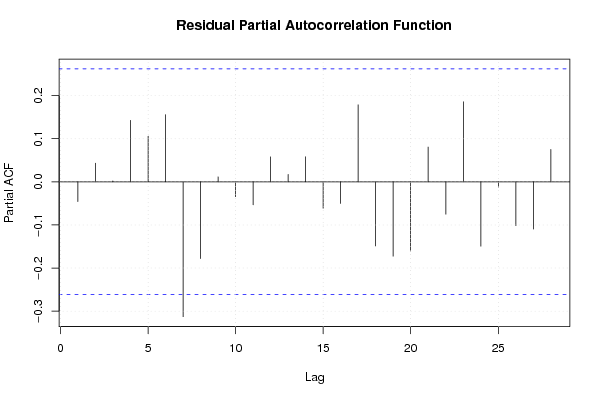
| Multiple Linear Regression - Residual Statistics | |
| Residual Standard Deviation | 7.32886552923144 |
| Sum Squared Residuals | 2094.77852787672 |
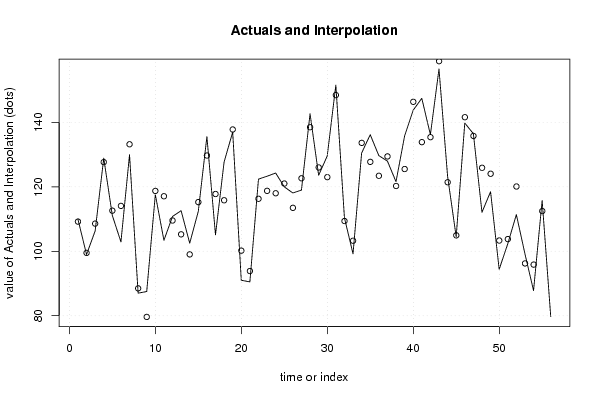
| Multiple Linear Regression - Actuals, Interpolation, and Residuals | |||
| Time or Index | Actuals | Interpolation Forecast | Residuals Prediction Error |
| 1 | 109.9 | 109.212767735444 | 0.68723226455576 |
| 2 | 99 | 99.4903502639618 | -0.490350263961782 |
| 3 | 106.3 | 108.580416803318 | -2.28041680331797 |
| 4 | 128.9 | 127.673494758077 | 1.22650524192338 |
| 5 | 111.1 | 112.605225545926 | -1.5052255459263 |
| 6 | 102.9 | 114.080477357934 | -11.1804773579336 |
| 7 | 130 | 133.213716703208 | -3.21371670320849 |
| 8 | 87 | 88.4829138207926 | -1.48291382079260 |
| 9 | 87.5 | 79.6209068831236 | 7.87909311687642 |
| 10 | 117.6 | 118.738210325022 | -1.13821032502169 |
| 11 | 103.4 | 117.078040295869 | -13.6780402958686 |
| 12 | 110.8 | 109.550851116525 | 1.24914888347462 |
| 13 | 112.6 | 105.256589968687 | 7.34341003131297 |
| 14 | 102.5 | 99.0296878672095 | 3.47031213279049 |
| 15 | 112.4 | 115.258428606013 | -2.85842860601337 |
| 16 | 135.6 | 129.720004740244 | 5.87999525975588 |
| 17 | 105.1 | 117.777551731008 | -12.6775517310083 |
| 18 | 127.7 | 115.833425716267 | 11.8665742837331 |
| 19 | 137 | 137.804727638847 | -0.80472763884663 |
| 20 | 91 | 100.196307624162 | -9.19630762416215 |
| 21 | 90.5 | 93.8641767232433 | -3.36417672324327 |
| 22 | 122.4 | 116.292805803375 | 6.10719419662516 |
| 23 | 123.3 | 118.760003496527 | 4.53999650347329 |
| 24 | 124.3 | 118.008673225956 | 6.29132677404438 |
| 25 | 120 | 121.021881733411 | -1.02188173341119 |
| 26 | 118.1 | 113.482383888557 | 4.61761611144324 |
| 27 | 119 | 122.650557846509 | -3.65055784650895 |
| 28 | 142.7 | 138.506407104831 | 4.19359289516854 |
| 29 | 123.6 | 126.021233992459 | -2.42123399245884 |
| 30 | 129.6 | 123.008156331213 | 6.59184366878675 |
| 31 | 151.6 | 148.49064390572 | 3.10935609427987 |
| 32 | 110.4 | 109.383307866949 | 1.01669213305060 |
| 33 | 99.2 | 103.270199762278 | -4.07019976227828 |
| 34 | 130.5 | 133.652168457702 | -3.15216845770247 |
| 35 | 136.2 | 127.753897984626 | 8.44610201537378 |
| 36 | 129.7 | 123.429630060671 | 6.27036993932885 |
| 37 | 128 | 129.444294178354 | -1.44429417835389 |
| 38 | 121.6 | 120.262136853044 | 1.33786314695553 |
| 39 | 135.8 | 125.527057886028 | 10.2729421139719 |
| 40 | 143.8 | 146.396242973125 | -2.59624297312532 |
| 41 | 147.5 | 133.873667080235 | 13.6263329197646 |
| 42 | 136.2 | 135.417561853593 | 0.782438146406968 |
| 43 | 156.6 | 159.014385210255 | -2.41438521025487 |
| 44 | 123.3 | 121.426644369008 | 1.87335563099220 |
| 45 | 104.5 | 104.944716631355 | -0.444716631354871 |
| 46 | 139.8 | 141.616815413901 | -1.816815413901 |
| 47 | 136.5 | 135.808058222978 | 0.691941777021569 |
| 48 | 112.1 | 125.910845596848 | -13.8108455968478 |
| 49 | 118.5 | 124.064466384104 | -5.56446638410365 |
| 50 | 94.4 | 103.335441127227 | -8.93544112722747 |
| 51 | 102.3 | 103.783538858132 | -1.48353885813164 |
| 52 | 111.4 | 120.103850423722 | -8.70385042372248 |
| 53 | 99.2 | 96.2223216503712 | 2.97767834962882 |
| 54 | 87.8 | 95.8603787409932 | -8.06037874099323 |
| 55 | 115.8 | 112.47652654197 | 3.32347345803011 |
| 56 | 79.7 | 71.910826319088 | 7.78917368091195 |
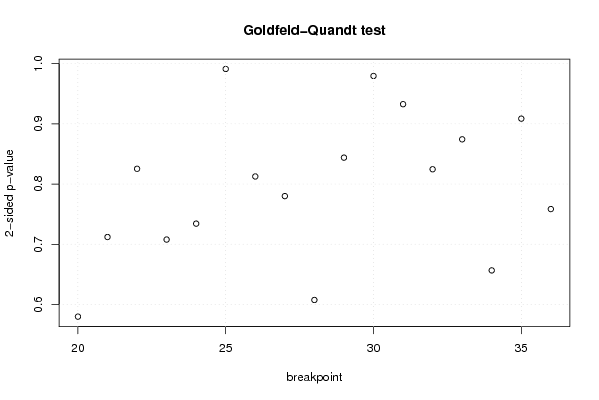
| Goldfeld-Quandt test for Heteroskedasticity | |||
| p-values | Alternative Hypothesis | ||
| breakpoint index | greater | 2-sided | less |
| 20 | 0.710064083303298 | 0.579871833393404 | 0.289935916696702 |
| 21 | 0.64395612483201 | 0.71208775033598 | 0.35604387516799 |
| 22 | 0.587317560642499 | 0.825364878715003 | 0.412682439357501 |
| 23 | 0.646064363175146 | 0.707871273649709 | 0.353935636824854 |
| 24 | 0.632851767946538 | 0.734296464106925 | 0.367148232053462 |
| 25 | 0.504429895369259 | 0.991140209261482 | 0.495570104630741 |
| 26 | 0.406311409239684 | 0.812622818479367 | 0.593688590760316 |
| 27 | 0.390006227417301 | 0.780012454834602 | 0.609993772582699 |
| 28 | 0.303784700402278 | 0.607569400804557 | 0.696215299597722 |
| 29 | 0.421941090899175 | 0.843882181798349 | 0.578058909100825 |
| 30 | 0.51025634677933 | 0.97948730644134 | 0.48974365322067 |
| 31 | 0.466325422073429 | 0.932650844146858 | 0.533674577926571 |
| 32 | 0.412297689936485 | 0.82459537987297 | 0.587702310063515 |
| 33 | 0.562846500250611 | 0.874306999498777 | 0.437153499749389 |
| 34 | 0.67166805795861 | 0.656663884082779 | 0.328331942041389 |
| 35 | 0.545693584745583 | 0.908612830508835 | 0.454306415254417 |
| 36 | 0.620744556270439 | 0.758510887459122 | 0.379255443729561 |
| Meta Analysis of Goldfeld-Quandt test for Heteroskedasticity | |||
| Description | # significant tests | % significant tests | OK/NOK |
| 1% type I error level | 0 | 0 | OK |
| 5% type I error level | 0 | 0 | OK |
| 10% type I error level | 0 | 0 | OK |