| Multiple Linear Regression - Estimated Regression Equation |
| Yt-4[t] = + 52.0823136100608 + 3.85640117510045X[t] + 17.6916980839663M1[t] + 7.16702112263573M2[t] + 18.1793683493212M3[t] + 46.3402276700147M4[t] + 5.23247106121416M5[t] -7.4523097356024M6[t] + 13.7663006215087M7[t] + 10.7416236601781M8[t] + 21.8799825079597M9[t] + 88.4472518580307M10[t] + 6.95388109059166M11[t] + 0.950420914326608t + e[t] |
| Multiple Linear Regression - Ordinary Least Squares | |||||
| Variable | Parameter | S.D. | T-STAT H0: parameter = 0 | 2-tail p-value | 1-tail p-value |
| (Intercept) | 52.0823136100608 | 35.535106 | 1.4657 | 0.150188 | 0.075094 |
| X | 3.85640117510045 | 4.123602 | 0.9352 | 0.35503 | 0.177515 |
| M1 | 17.6916980839663 | 9.253217 | 1.912 | 0.06272 | 0.03136 |
| M2 | 7.16702112263573 | 9.285444 | 0.7719 | 0.444521 | 0.222261 |
| M3 | 18.1793683493212 | 9.22849 | 1.9699 | 0.055465 | 0.027733 |
| M4 | 46.3402276700147 | 9.170715 | 5.0531 | 9e-06 | 4e-06 |
| M5 | 5.23247106121416 | 9.183559 | 0.5698 | 0.571872 | 0.285936 |
| M6 | -7.4523097356024 | 9.208474 | -0.8093 | 0.422911 | 0.211455 |
| M7 | 13.7663006215087 | 9.325626 | 1.4762 | 0.147354 | 0.073677 |
| M8 | 10.7416236601781 | 9.38255 | 1.1449 | 0.258753 | 0.129377 |
| M9 | 21.8799825079597 | 9.676069 | 2.2612 | 0.028983 | 0.014492 |
| M10 | 88.4472518580307 | 9.66519 | 9.1511 | 0 | 0 |
| M11 | 6.95388109059166 | 9.685206 | 0.718 | 0.476738 | 0.238369 |
| t | 0.950420914326608 | 0.157422 | 6.0374 | 0 | 0 |
| Multiple Linear Regression - Regression Statistics | |
| Multiple R | 0.915004088656497 |
| R-squared | 0.837232482258107 |
| Adjusted R-squared | 0.786852060099902 |
| F-TEST (value) | 16.6182109317985 |
| F-TEST (DF numerator) | 13 |
| F-TEST (DF denominator) | 42 |
| p-value | 1.55486734598753e-12 |
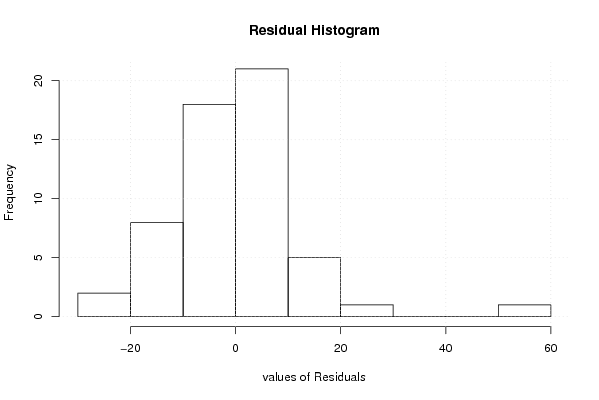
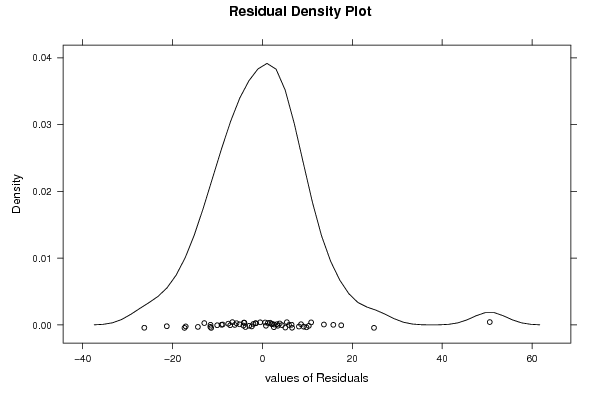
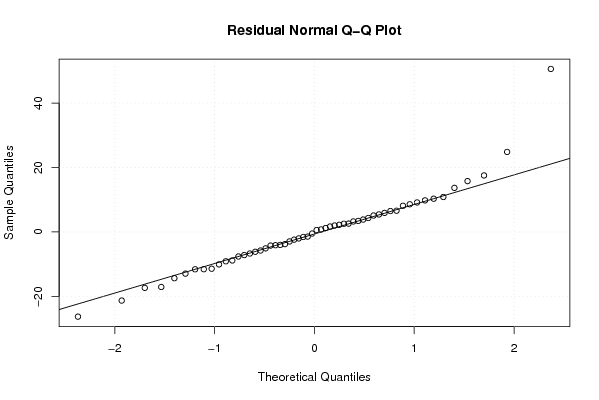
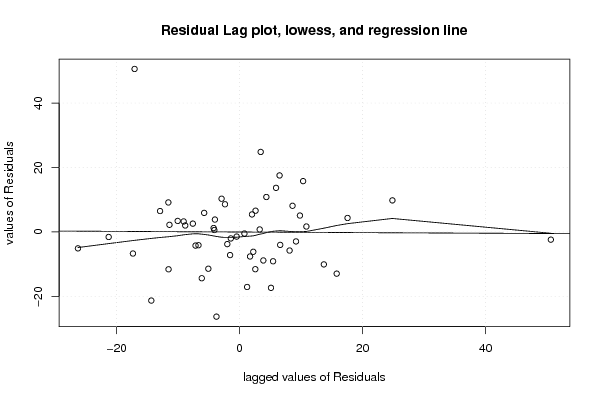
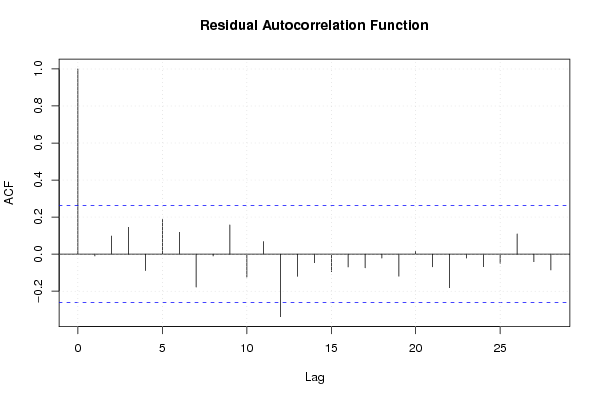
| Multiple Linear Regression - Residual Statistics | |
| Residual Standard Deviation | 13.6573269030295 |
| Sum Squared Residuals | 7833.94828172099 |
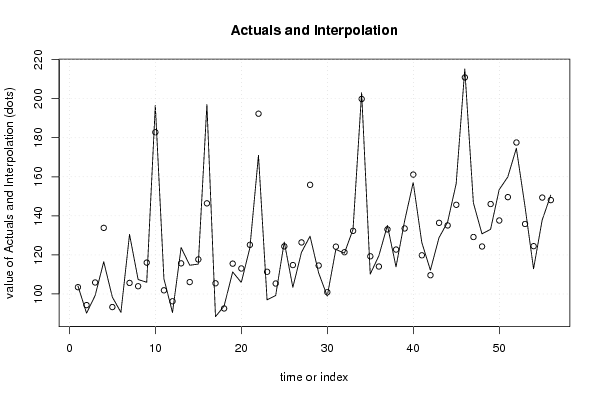
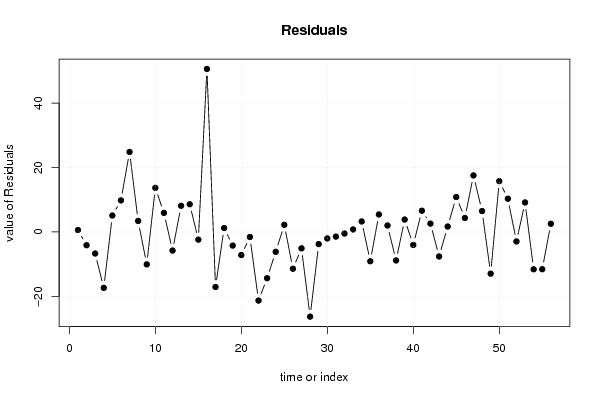
| Multiple Linear Regression - Actuals, Interpolation, and Residuals | |||
| Time or Index | Actuals | Interpolation Forecast | Residuals Prediction Error |
| 1 | 104.1 | 103.503842596708 | 0.596157403292294 |
| 2 | 90.2 | 94.3152266672137 | -4.11522666721365 |
| 3 | 99.2 | 105.892354690716 | -6.69235469071565 |
| 4 | 116.5 | 133.846714573206 | -17.3467145732056 |
| 5 | 98.4 | 93.3037387612217 | 5.09626123877832 |
| 6 | 90.6 | 80.7980986437116 | 9.80190135628835 |
| 7 | 130.5 | 105.666610737720 | 24.8333892622803 |
| 8 | 107.4 | 103.977994808226 | 3.4220051917743 |
| 9 | 106 | 116.066774570334 | -10.0667745703340 |
| 10 | 196.5 | 182.813184599711 | 13.6868154002885 |
| 11 | 107.8 | 101.884594629089 | 5.91540537091103 |
| 12 | 90.5 | 96.266774570334 | -5.76677457033391 |
| 13 | 123.8 | 115.680173803647 | 8.11982619635302 |
| 14 | 114.7 | 106.105917756643 | 8.59408224335702 |
| 15 | 115.3 | 117.683045780145 | -2.383045780145 |
| 16 | 197 | 146.408685897655 | 50.591314102345 |
| 17 | 88.4 | 105.480069968161 | -17.0800699681611 |
| 18 | 93.8 | 92.588789733141 | 1.21121026685903 |
| 19 | 111.3 | 115.529101239599 | -4.22910123959879 |
| 20 | 105.9 | 113.069205075085 | -7.16920507508472 |
| 21 | 123.6 | 125.157984837193 | -1.55798483719297 |
| 22 | 171 | 192.290034984081 | -21.2900349840805 |
| 23 | 97 | 111.361445013458 | -14.3614450134581 |
| 24 | 99.2 | 105.357984837193 | -6.15798483719299 |
| 25 | 126.6 | 124.385743952996 | 2.21425604700404 |
| 26 | 103.4 | 114.811487905992 | -11.4114879059920 |
| 27 | 121.3 | 126.388615929494 | -5.08861592949398 |
| 28 | 129.6 | 155.885536282024 | -26.2855362820241 |
| 29 | 110.8 | 114.57128023502 | -3.7712802350201 |
| 30 | 98.9 | 100.90871976498 | -2.0087197649799 |
| 31 | 122.8 | 124.234671388948 | -1.43467138894778 |
| 32 | 120.9 | 121.389135106924 | -0.489135106923657 |
| 33 | 133.1 | 132.320994516502 | 0.77900548349823 |
| 34 | 203.1 | 199.838684780899 | 3.26131521910062 |
| 35 | 110.2 | 119.295734927787 | -9.09573492778693 |
| 36 | 119.5 | 114.063554986542 | 5.43644501345803 |
| 37 | 135.1 | 133.091314102345 | 2.00868589765506 |
| 38 | 113.9 | 122.745777820321 | -8.84577782032084 |
| 39 | 137.4 | 133.551625608803 | 3.84837439119724 |
| 40 | 157.1 | 161.120345373783 | -4.02034537378268 |
| 41 | 126.4 | 119.806089326779 | 6.59391067322133 |
| 42 | 112.2 | 109.614289914329 | 2.58571008567113 |
| 43 | 128.8 | 136.411002595887 | -7.61100259588715 |
| 44 | 136.8 | 135.108026783903 | 1.69197321609678 |
| 45 | 156.5 | 145.654246075971 | 10.8457539240287 |
| 46 | 215.2 | 210.858095635309 | 4.34190436469139 |
| 47 | 146.7 | 129.158225429666 | 17.5417745703339 |
| 48 | 130.8 | 124.311685605931 | 6.48831439406889 |
| 49 | 133.1 | 146.038925544304 | -12.9389255443044 |
| 50 | 153.4 | 137.621589849831 | 15.7784101501695 |
| 51 | 159.9 | 149.584357990843 | 10.3156420091574 |
| 52 | 174.6 | 177.538717873333 | -2.93871787333257 |
| 53 | 145 | 135.838821708819 | 9.1611782911815 |
| 54 | 112.9 | 124.490101943839 | -11.5901019438386 |
| 55 | 137.8 | 149.358614037847 | -11.5586140378466 |
| 56 | 150.6 | 148.055638225863 | 2.54436177413731 |
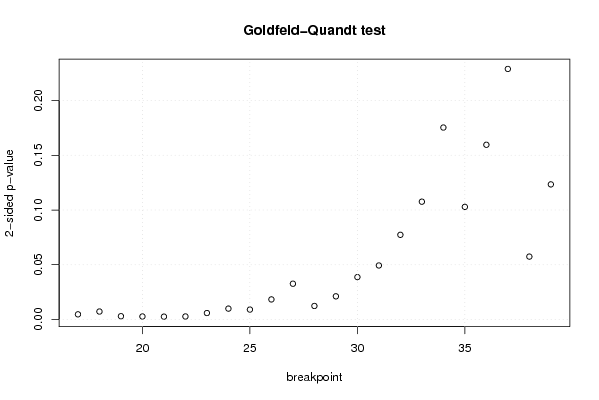
| Goldfeld-Quandt test for Heteroskedasticity | |||
| p-values | Alternative Hypothesis | ||
| breakpoint index | greater | 2-sided | less |
| 17 | 0.997653314461693 | 0.00469337107661466 | 0.00234668553830733 |
| 18 | 0.99637670405127 | 0.0072465918974607 | 0.00362329594873035 |
| 19 | 0.9985138805747 | 0.00297223885060064 | 0.00148611942530032 |
| 20 | 0.998637540054493 | 0.00272491989101306 | 0.00136245994550653 |
| 21 | 0.998712919833262 | 0.00257416033347562 | 0.00128708016673781 |
| 22 | 0.9986307237505 | 0.00273855249899947 | 0.00136927624949973 |
| 23 | 0.997057072759163 | 0.00588585448167466 | 0.00294292724083733 |
| 24 | 0.995044625286528 | 0.009910749426943 | 0.0049553747134715 |
| 25 | 0.995477915233546 | 0.00904416953290819 | 0.00452208476645410 |
| 26 | 0.990839374539447 | 0.0183212509211052 | 0.00916062546055262 |
| 27 | 0.98367828897318 | 0.0326434220536392 | 0.0163217110268196 |
| 28 | 0.993824116018194 | 0.0123517679636124 | 0.00617588398180618 |
| 29 | 0.98942471741707 | 0.0211505651658602 | 0.0105752825829301 |
| 30 | 0.980651960738655 | 0.0386960785226896 | 0.0193480392613448 |
| 31 | 0.975342754267022 | 0.0493144914659558 | 0.0246572457329779 |
| 32 | 0.961337827063382 | 0.0773243458732355 | 0.0386621729366177 |
| 33 | 0.946202307651526 | 0.107595384696947 | 0.0537976923484736 |
| 34 | 0.912346182919296 | 0.175307634161407 | 0.0876538170807036 |
| 35 | 0.948572594317654 | 0.102854811364692 | 0.0514274056823459 |
| 36 | 0.920209995811805 | 0.159580008376389 | 0.0797900041881946 |
| 37 | 0.885579712285123 | 0.228840575429755 | 0.114420287714877 |
| 38 | 0.97129214626313 | 0.0574157074737401 | 0.0287078537368700 |
| 39 | 0.93830155239731 | 0.123396895205378 | 0.061698447602689 |
| Meta Analysis of Goldfeld-Quandt test for Heteroskedasticity | |||
| Description | # significant tests | % significant tests | OK/NOK |
| 1% type I error level | 9 | 0.391304347826087 | NOK |
| 5% type I error level | 15 | 0.652173913043478 | NOK |
| 10% type I error level | 17 | 0.739130434782609 | NOK |