| Multiple Linear Regression - Estimated Regression Equation |
| Yt-2[t] = + 54.4478692187951 + 4.89094083246159X[t] + 8.17504404347599M1[t] + 35.332449512388M2[t] -6.22759448550611M3[t] -18.3563632168033M4[t] + 6.48832450184722M5[t] + 4.07046168730386M6[t] + 11.9911214733882M7[t] + 76.9885269423002M8[t] -3.9423174731238M9[t] -9.25381268360943M10[t] + 10.0205980226587M11[t] + 0.986956897789507t + e[t] |
| Multiple Linear Regression - Ordinary Least Squares | |||||
| Variable | Parameter | S.D. | T-STAT H0: parameter = 0 | 2-tail p-value | 1-tail p-value |
| (Intercept) | 54.4478692187951 | 35.369472 | 1.5394 | 0.131207 | 0.065603 |
| X | 4.89094083246159 | 4.104381 | 1.1916 | 0.240093 | 0.120047 |
| M1 | 8.17504404347599 | 9.210087 | 0.8876 | 0.379801 | 0.1899 |
| M2 | 35.332449512388 | 9.242163 | 3.823 | 0.00043 | 0.000215 |
| M3 | -6.22759448550611 | 9.185475 | -0.678 | 0.501501 | 0.25075 |
| M4 | -18.3563632168033 | 9.127969 | -2.011 | 0.050773 | 0.025386 |
| M5 | 6.48832450184722 | 9.140753 | 0.7098 | 0.481736 | 0.240868 |
| M6 | 4.07046168730386 | 9.165552 | 0.4441 | 0.659247 | 0.329623 |
| M7 | 11.9911214733882 | 9.282158 | 1.2918 | 0.203474 | 0.101737 |
| M8 | 76.9885269423002 | 9.338817 | 8.2439 | 0 | 0 |
| M9 | -3.9423174731238 | 9.630967 | -0.4093 | 0.684372 | 0.342186 |
| M10 | -9.25381268360943 | 9.620139 | -0.9619 | 0.341595 | 0.170797 |
| M11 | 10.0205980226587 | 9.640061 | 1.0395 | 0.304531 | 0.152266 |
| t | 0.986956897789507 | 0.156688 | 6.2989 | 0 | 0 |
| Multiple Linear Regression - Regression Statistics | |
| Multiple R | 0.928748055628976 |
| R-squared | 0.862572950834603 |
| Adjusted R-squared | 0.820036007045314 |
| F-TEST (value) | 20.2782069889044 |
| F-TEST (DF numerator) | 13 |
| F-TEST (DF denominator) | 42 |
| p-value | 5.19584375524573e-14 |
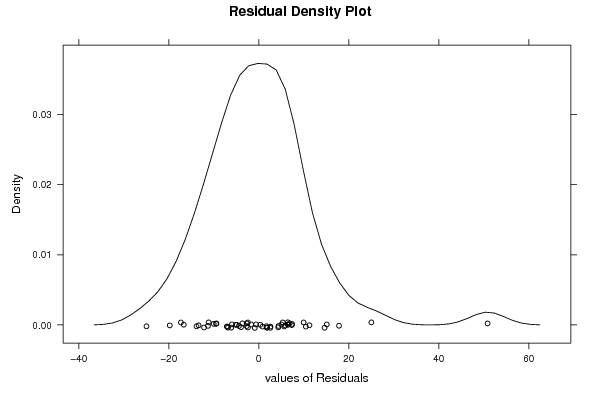
| Multiple Linear Regression - Residual Statistics | |
| Residual Standard Deviation | 13.5936681097854 |
| Sum Squared Residuals | 7761.08813251787 |
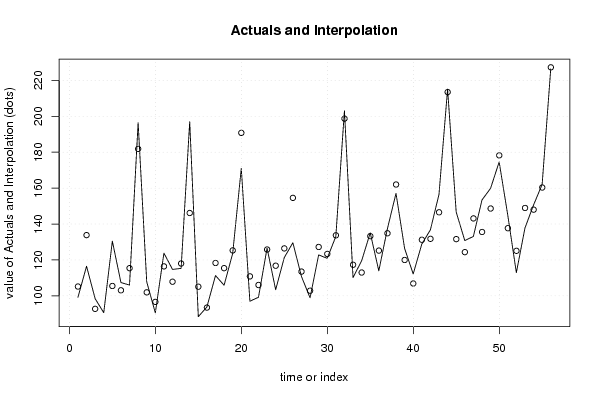
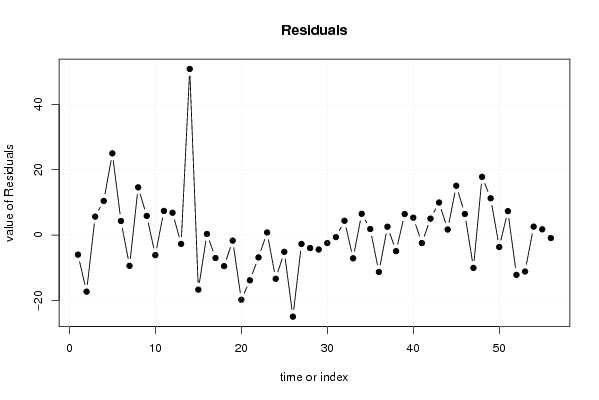
| Multiple Linear Regression - Actuals, Interpolation, and Residuals | |||
| Time or Index | Actuals | Interpolation Forecast | Residuals Prediction Error |
| 1 | 99.2 | 105.182867235984 | -5.98286723598409 |
| 2 | 116.5 | 133.816323685932 | -17.3163236859318 |
| 3 | 98.4 | 92.754142502581 | 5.64585749741893 |
| 4 | 90.6 | 80.1450484193349 | 10.4549515806651 |
| 5 | 130.5 | 105.487598952529 | 25.0124010474712 |
| 6 | 107.4 | 103.078504869283 | 4.32149513071737 |
| 7 | 106 | 115.409780135880 | -9.40978013587954 |
| 8 | 196.5 | 181.883236585827 | 14.6167634141728 |
| 9 | 107.8 | 101.939349068193 | 5.86065093180723 |
| 10 | 90.5 | 96.6366225890043 | -6.13662258900427 |
| 11 | 123.8 | 116.408896109816 | 7.39110389018417 |
| 12 | 114.7 | 107.864349068193 | 6.83565093180724 |
| 13 | 115.3 | 118.004538175951 | -2.70453817595057 |
| 14 | 197 | 146.148900542652 | 50.8510994573479 |
| 15 | 88.4 | 105.086719359301 | -16.6867193593013 |
| 16 | 93.8 | 93.4558134425475 | 0.344186557452507 |
| 17 | 111.3 | 118.309269892495 | -7.0092698924952 |
| 18 | 105.9 | 115.411081726003 | -9.51108172600286 |
| 19 | 123.6 | 125.296886576369 | -1.696886576369 |
| 20 | 171 | 190.792154859824 | -19.7921548598244 |
| 21 | 97 | 110.84826734219 | -13.8482673421899 |
| 22 | 99.2 | 106.034634946248 | -6.8346349462476 |
| 23 | 126.6 | 125.806908467059 | 0.793091532940871 |
| 24 | 103.4 | 116.77326734219 | -13.3732673421899 |
| 25 | 121.3 | 126.424362366702 | -5.12436236670156 |
| 26 | 129.6 | 154.568724733403 | -24.9687247334031 |
| 27 | 110.8 | 113.506543550052 | -2.70654355005232 |
| 28 | 98.9 | 102.853825799791 | -3.95382579979078 |
| 29 | 122.8 | 127.218188166492 | -4.41818816649232 |
| 30 | 120.9 | 123.341811833508 | -2.44181183350767 |
| 31 | 133.1 | 133.71671076712 | -0.616710767119976 |
| 32 | 203.1 | 198.722884967329 | 4.37711503267079 |
| 33 | 110.2 | 117.311715199956 | -7.11171519995622 |
| 34 | 119.5 | 112.987176887260 | 6.5128231127399 |
| 35 | 135.1 | 133.248544491318 | 1.85145550868221 |
| 36 | 113.9 | 125.193091532941 | -11.2930915329409 |
| 37 | 137.4 | 134.844186557453 | 2.55581344254747 |
| 38 | 157.1 | 162.010360757662 | -4.91036075766174 |
| 39 | 126.4 | 119.969991407819 | 6.43000859218135 |
| 40 | 112.2 | 106.871803241326 | 5.32819675867367 |
| 41 | 128.8 | 131.236165608028 | -2.43616560802787 |
| 42 | 136.8 | 131.761636024259 | 5.03836397574135 |
| 43 | 156.5 | 146.538381707086 | 9.96161829291363 |
| 44 | 215.2 | 213.500932240280 | 1.69906775971974 |
| 45 | 146.7 | 131.600668389661 | 15.0993316103389 |
| 46 | 130.8 | 124.341565577488 | 6.45843442251198 |
| 47 | 133.1 | 143.135650931807 | -10.0356509318072 |
| 48 | 153.4 | 135.569292056676 | 17.8307079433235 |
| 49 | 159.9 | 148.644045663911 | 11.2559543360887 |
| 50 | 174.6 | 178.255690280351 | -3.65569028035125 |
| 51 | 145 | 137.682603180247 | 7.31739681975335 |
| 52 | 112.9 | 125.073509097000 | -12.1735090970005 |
| 53 | 137.8 | 148.948777380456 | -11.1487773804558 |
| 54 | 150.6 | 148.006965546948 | 2.59303445305181 |
| 55 | 162.1 | 160.338240813545 | 1.76175918645488 |
| 56 | 226.4 | 227.300791346739 | -0.900791346738928 |
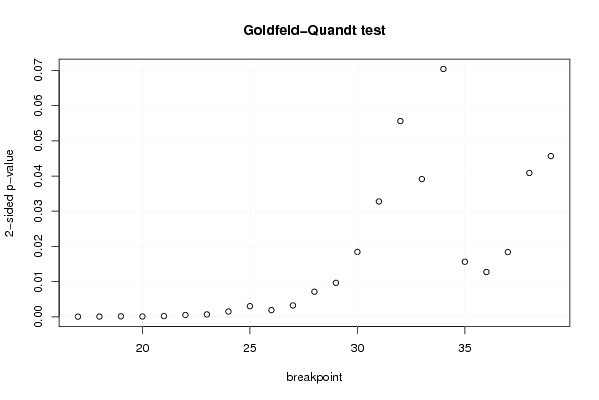
| Goldfeld-Quandt test for Heteroskedasticity | |||
| p-values | Alternative Hypothesis | ||
| breakpoint index | greater | 2-sided | less |
| 17 | 0.999981449015207 | 3.71019695860039e-05 | 1.85509847930020e-05 |
| 18 | 0.999968134442427 | 6.37311151467366e-05 | 3.18655575733683e-05 |
| 19 | 0.999933285300983 | 0.000133429398033199 | 6.67146990165996e-05 |
| 20 | 0.99995918619029 | 8.16276194210365e-05 | 4.08138097105183e-05 |
| 21 | 0.999898567541707 | 0.000202864916585699 | 0.000101432458292849 |
| 22 | 0.99974621372632 | 0.000507572547359565 | 0.000253786273679782 |
| 23 | 0.999662128160101 | 0.000675743679798275 | 0.000337871839899138 |
| 24 | 0.999253175171666 | 0.00149364965666900 | 0.000746824828334502 |
| 25 | 0.998492250864936 | 0.00301549827012846 | 0.00150774913506423 |
| 26 | 0.999048212423894 | 0.00190357515221102 | 0.00095178757610551 |
| 27 | 0.99838936297129 | 0.00322127405742173 | 0.00161063702871087 |
| 28 | 0.996438991643483 | 0.0071220167130337 | 0.00356100835651685 |
| 29 | 0.995176291079508 | 0.00964741784098373 | 0.00482370892049187 |
| 30 | 0.990778457030604 | 0.0184430859387918 | 0.00922154296939588 |
| 31 | 0.983615137330343 | 0.0327697253393138 | 0.0163848626696569 |
| 32 | 0.972194534729024 | 0.0556109305419526 | 0.0278054652709763 |
| 33 | 0.980436544249 | 0.0391269115020001 | 0.0195634557510000 |
| 34 | 0.96478885664628 | 0.0704222867074411 | 0.0352111433537206 |
| 35 | 0.992179250499202 | 0.0156414990015954 | 0.00782074950079772 |
| 36 | 0.993635218746245 | 0.0127295625075106 | 0.00636478125375532 |
| 37 | 0.990805230397972 | 0.018389539204057 | 0.0091947696020285 |
| 38 | 0.979566308208543 | 0.040867383582914 | 0.020433691791457 |
| 39 | 0.977170741751491 | 0.0456585164970175 | 0.0228292582485088 |
| Meta Analysis of Goldfeld-Quandt test for Heteroskedasticity | |||
| Description | # significant tests | % significant tests | OK/NOK |
| 1% type I error level | 13 | 0.565217391304348 | NOK |
| 5% type I error level | 21 | 0.91304347826087 | NOK |
| 10% type I error level | 23 | 1 | NOK |