| Multiple Linear Regression - Estimated Regression Equation |
| WMan>25[t] = + 6.38588796845063 -0.160470000726172Infl[t] + e[t] |
| Multiple Linear Regression - Ordinary Least Squares | |||||
| Variable | Parameter | S.D. | T-STAT H0: parameter = 0 | 2-tail p-value | 1-tail p-value |
| (Intercept) | 6.38588796845063 | 0.12663 | 50.4296 | 0 | 0 |
| Infl | -0.160470000726172 | 0.044702 | -3.5897 | 0.000682 | 0.000341 |
| Multiple Linear Regression - Regression Statistics | |
| Multiple R | 0.426365369418309 |
| R-squared | 0.181787428239211 |
| Adjusted R-squared | 0.167680314932991 |
| F-TEST (value) | 12.8862244382097 |
| F-TEST (DF numerator) | 1 |
| F-TEST (DF denominator) | 58 |
| p-value | 0.000681690348453667 |
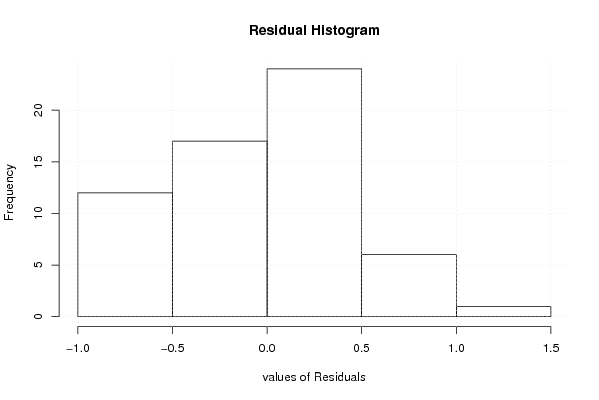
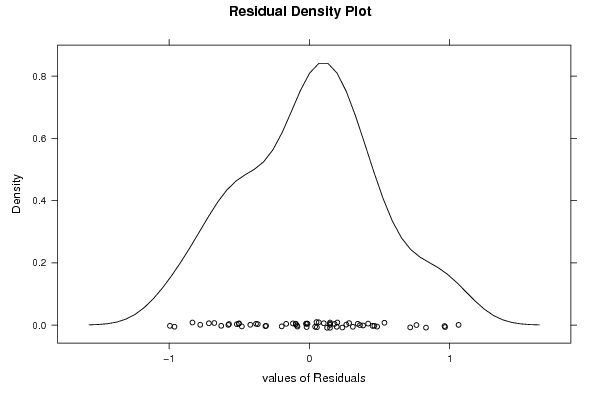
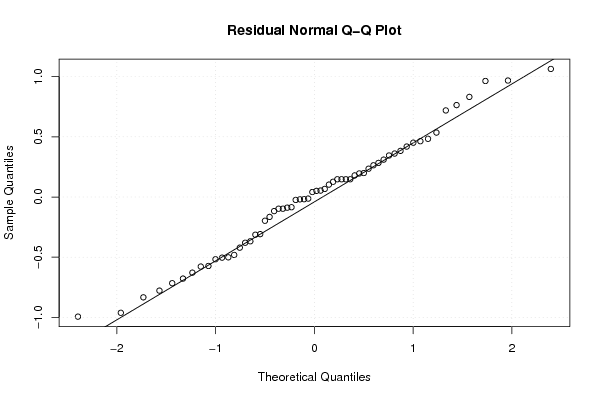
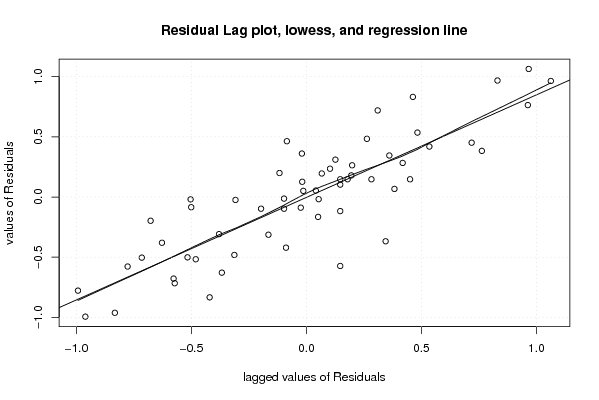
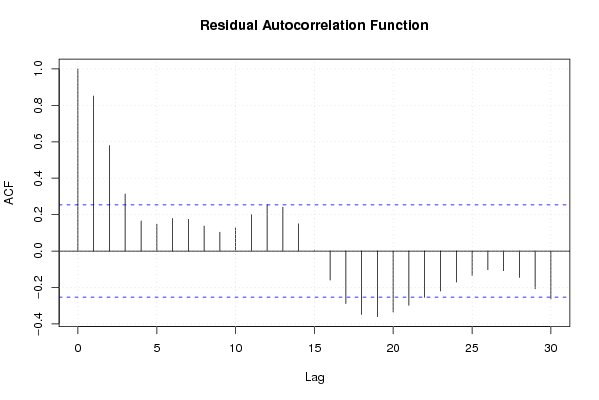
| Multiple Linear Regression - Residual Statistics | |
| Residual Standard Deviation | 0.48835694565493 |
| Sum Squared Residuals | 13.8325653694259 |
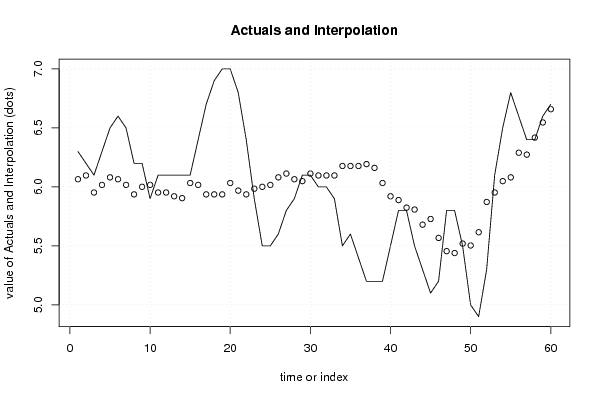
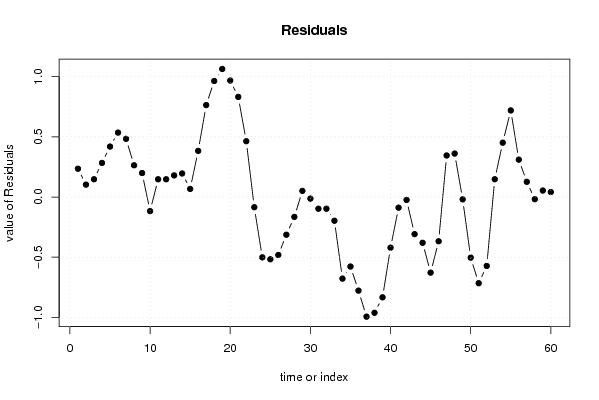
| Multiple Linear Regression - Actuals, Interpolation, and Residuals | |||
| Time or Index | Actuals | Interpolation Forecast | Residuals Prediction Error |
| 1 | 6.3 | 6.06494796699829 | 0.235052033001706 |
| 2 | 6.2 | 6.09704196714352 | 0.102958032856481 |
| 3 | 6.1 | 5.95261896648996 | 0.147381033510035 |
| 4 | 6.3 | 6.01680696678043 | 0.283193033219566 |
| 5 | 6.5 | 6.0809949670709 | 0.419005032929098 |
| 6 | 6.6 | 6.06494796699829 | 0.535052033001715 |
| 7 | 6.5 | 6.01680696678043 | 0.483193033219567 |
| 8 | 6.2 | 5.93657196641735 | 0.263428033582653 |
| 9 | 6.2 | 6.00075996670782 | 0.199240033292184 |
| 10 | 5.9 | 6.01680696678043 | -0.116806966780433 |
| 11 | 6.1 | 5.95261896648996 | 0.147381033510035 |
| 12 | 6.1 | 5.95261896648996 | 0.147381033510035 |
| 13 | 6.1 | 5.92052496634473 | 0.179475033655269 |
| 14 | 6.1 | 5.90447796627211 | 0.195522033727886 |
| 15 | 6.1 | 6.03285396685305 | 0.0671460331469491 |
| 16 | 6.4 | 6.01680696678043 | 0.383193033219567 |
| 17 | 6.7 | 5.93657196641735 | 0.763428033582653 |
| 18 | 6.9 | 5.93657196641735 | 0.963428033582653 |
| 19 | 7 | 5.93657196641735 | 1.06342803358265 |
| 20 | 7 | 6.03285396685305 | 0.96714603314695 |
| 21 | 6.8 | 5.96866596656258 | 0.831334033437418 |
| 22 | 6.4 | 5.93657196641735 | 0.463428033582653 |
| 23 | 5.9 | 5.9847129666352 | -0.0847129666351987 |
| 24 | 5.5 | 6.00075996670782 | -0.500759966707816 |
| 25 | 5.5 | 6.01680696678043 | -0.516806966780433 |
| 26 | 5.6 | 6.0809949670709 | -0.480994967070903 |
| 27 | 5.8 | 6.11308896721614 | -0.313088967216137 |
| 28 | 5.9 | 6.06494796699829 | -0.164947966998285 |
| 29 | 6.1 | 6.04890096692567 | 0.0510990330743319 |
| 30 | 6.1 | 6.11308896721614 | -0.0130889672161368 |
| 31 | 6 | 6.09704196714352 | -0.0970419671435193 |
| 32 | 6 | 6.09704196714352 | -0.0970419671435193 |
| 33 | 5.9 | 6.09704196714352 | -0.197041967143519 |
| 34 | 5.5 | 6.1772769675066 | -0.677276967506605 |
| 35 | 5.6 | 6.1772769675066 | -0.577276967506606 |
| 36 | 5.4 | 6.1772769675066 | -0.777276967506605 |
| 37 | 5.2 | 6.19332396757922 | -0.993323967579222 |
| 38 | 5.2 | 6.16122996743399 | -0.961229967433988 |
| 39 | 5.2 | 6.03285396685305 | -0.83285396685305 |
| 40 | 5.5 | 5.92052496634473 | -0.42052496634473 |
| 41 | 5.8 | 5.88843096619950 | -0.0884309661994961 |
| 42 | 5.8 | 5.82424296590903 | -0.0242429659090275 |
| 43 | 5.5 | 5.80819596583641 | -0.30819596583641 |
| 44 | 5.3 | 5.67981996525547 | -0.379819965255473 |
| 45 | 5.1 | 5.72796096547332 | -0.627960965473325 |
| 46 | 5.2 | 5.56749096474715 | -0.367490964747152 |
| 47 | 5.8 | 5.45516196423883 | 0.344838035761168 |
| 48 | 5.8 | 5.43911496416622 | 0.360885035833785 |
| 49 | 5.5 | 5.5193499645293 | -0.0193499645293008 |
| 50 | 5 | 5.50330296445668 | -0.503302964456684 |
| 51 | 4.9 | 5.615631964965 | -0.715631964965004 |
| 52 | 5.3 | 5.87238396612688 | -0.572383966126879 |
| 53 | 6.1 | 5.95261896648996 | 0.147381033510035 |
| 54 | 6.5 | 6.04890096692567 | 0.451099033074332 |
| 55 | 6.8 | 6.0809949670709 | 0.719005032929098 |
| 56 | 6.6 | 6.28960596801493 | 0.310394031985074 |
| 57 | 6.4 | 6.27355896794231 | 0.126441032057692 |
| 58 | 6.4 | 6.41798196859586 | -0.0179819685958625 |
| 59 | 6.6 | 6.5463579691768 | 0.0536420308231993 |
| 60 | 6.7 | 6.65868696968512 | 0.0413130303148796 |
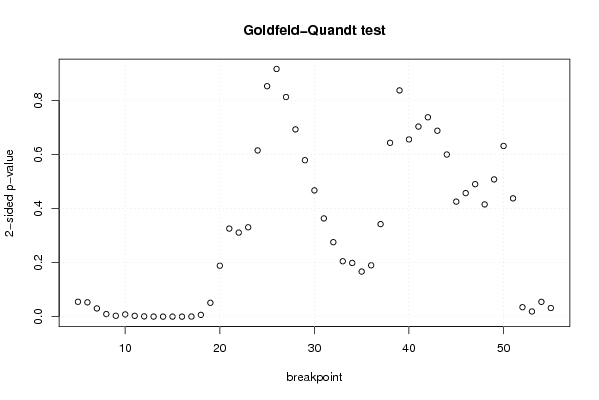
| Goldfeld-Quandt test for Heteroskedasticity | |||
| p-values | Alternative Hypothesis | ||
| breakpoint index | greater | 2-sided | less |
| 5 | 0.0274980816320827 | 0.0549961632641654 | 0.972501918367917 |
| 6 | 0.0265279601236305 | 0.0530559202472611 | 0.97347203987637 |
| 7 | 0.0152526478162500 | 0.0305052956325001 | 0.98474735218375 |
| 8 | 0.00478475311789227 | 0.00956950623578454 | 0.995215246882108 |
| 9 | 0.00161378932011810 | 0.00322757864023619 | 0.998386210679882 |
| 10 | 0.00414849135594805 | 0.0082969827118961 | 0.995851508644052 |
| 11 | 0.00150220832250578 | 0.00300441664501156 | 0.998497791677494 |
| 12 | 0.00051212153298762 | 0.00102424306597524 | 0.999487878467012 |
| 13 | 0.000165069933210901 | 0.000330139866421801 | 0.999834930066789 |
| 14 | 5.22067028762867e-05 | 0.000104413405752573 | 0.999947793297124 |
| 15 | 2.6221709576041e-05 | 5.2443419152082e-05 | 0.999973778290424 |
| 16 | 1.21096151177987e-05 | 2.42192302355973e-05 | 0.999987890384882 |
| 17 | 0.000204370546039924 | 0.000408741092079849 | 0.99979562945396 |
| 18 | 0.00329605166570514 | 0.00659210333141027 | 0.996703948334295 |
| 19 | 0.0256585484139815 | 0.051317096827963 | 0.974341451586018 |
| 20 | 0.0942678977668756 | 0.188535795533751 | 0.905732102233124 |
| 21 | 0.162926019432227 | 0.325852038864455 | 0.837073980567773 |
| 22 | 0.155546742565706 | 0.311093485131412 | 0.844453257434294 |
| 23 | 0.165352530691414 | 0.330705061382829 | 0.834647469308586 |
| 24 | 0.307506000135365 | 0.615012000270729 | 0.692493999864635 |
| 25 | 0.426320720573305 | 0.85264144114661 | 0.573679279426695 |
| 26 | 0.458209578796707 | 0.916419157593415 | 0.541790421203293 |
| 27 | 0.406262300800039 | 0.812524601600077 | 0.593737699199961 |
| 28 | 0.346410221939443 | 0.692820443878886 | 0.653589778060557 |
| 29 | 0.289374193247156 | 0.578748386494313 | 0.710625806752844 |
| 30 | 0.233584100678006 | 0.467168201356012 | 0.766415899321994 |
| 31 | 0.181716619756316 | 0.363433239512633 | 0.818283380243684 |
| 32 | 0.137745753148958 | 0.275491506297916 | 0.862254246851042 |
| 33 | 0.102489204013804 | 0.204978408027608 | 0.897510795986196 |
| 34 | 0.0993922756983946 | 0.198784551396789 | 0.900607724301605 |
| 35 | 0.0834254156259888 | 0.166850831251978 | 0.916574584374011 |
| 36 | 0.0949671354706091 | 0.189934270941218 | 0.90503286452939 |
| 37 | 0.171196124386296 | 0.342392248772592 | 0.828803875613704 |
| 38 | 0.321566705291908 | 0.643133410583815 | 0.678433294708092 |
| 39 | 0.581474842908859 | 0.837050314182281 | 0.418525157091141 |
| 40 | 0.672202294987515 | 0.65559541002497 | 0.327797705012485 |
| 41 | 0.648405104813611 | 0.703189790372779 | 0.351594895186389 |
| 42 | 0.63118988088586 | 0.73762023822828 | 0.36881011911414 |
| 43 | 0.656070136640316 | 0.687859726719367 | 0.343929863359684 |
| 44 | 0.700070305428296 | 0.599859389143407 | 0.299929694571704 |
| 45 | 0.787181528410556 | 0.425636943178888 | 0.212818471589444 |
| 46 | 0.771453676349413 | 0.457092647301173 | 0.228546323650587 |
| 47 | 0.754947221662361 | 0.490105556675279 | 0.245052778337639 |
| 48 | 0.792300567589804 | 0.415398864820391 | 0.207699432410196 |
| 49 | 0.746119320249597 | 0.507761359500806 | 0.253880679750403 |
| 50 | 0.684234581079164 | 0.631530837841672 | 0.315765418920836 |
| 51 | 0.781163866207255 | 0.43767226758549 | 0.218836133792745 |
| 52 | 0.982531294436327 | 0.0349374111273456 | 0.0174687055636728 |
| 53 | 0.990419384277556 | 0.0191612314448882 | 0.0095806157224441 |
| 54 | 0.972584606461741 | 0.0548307870765179 | 0.0274153935382590 |
| 55 | 0.98399671564356 | 0.0320065687128818 | 0.0160032843564409 |
| Meta Analysis of Goldfeld-Quandt test for Heteroskedasticity | |||
| Description | # significant tests | % significant tests | OK/NOK |
| 1% type I error level | 11 | 0.215686274509804 | NOK |
| 5% type I error level | 15 | 0.294117647058824 | NOK |
| 10% type I error level | 19 | 0.372549019607843 | NOK |