| Multiple Linear Regression - Estimated Regression Equation |
| WMan>25[t] = + 6.22333640930995 -0.152517174202809Infl[t] -0.082389008510204M1[t] -0.188489695478315M2[t] -0.188489695478314M3[t] + 0.0440572131651802M4[t] + 0.401006869681123M5[t] + 0.525755152260843M6[t] + 0.514906182713011M7[t] + 0.356604121808674M8[t] + 0.210503434840562M9[t] + 0.00135240438839345M10[t] + 0.121352404388393M11[t] + e[t] |
| Multiple Linear Regression - Ordinary Least Squares | |||||
| Variable | Parameter | S.D. | T-STAT H0: parameter = 0 | 2-tail p-value | 1-tail p-value |
| (Intercept) | 6.22333640930995 | 0.227745 | 27.3258 | 0 | 0 |
| Infl | -0.152517174202809 | 0.043116 | -3.5374 | 0.000921 | 0.000461 |
| M1 | -0.082389008510204 | 0.29629 | -0.2781 | 0.782179 | 0.391089 |
| M2 | -0.188489695478315 | 0.296134 | -0.6365 | 0.527538 | 0.263769 |
| M3 | -0.188489695478314 | 0.296134 | -0.6365 | 0.527538 | 0.263769 |
| M4 | 0.0440572131651802 | 0.295557 | 0.1491 | 0.88214 | 0.44107 |
| M5 | 0.401006869681123 | 0.295506 | 1.357 | 0.181257 | 0.090628 |
| M6 | 0.525755152260843 | 0.295285 | 1.7805 | 0.081459 | 0.040729 |
| M7 | 0.514906182713011 | 0.29541 | 1.743 | 0.087869 | 0.043935 |
| M8 | 0.356604121808674 | 0.295183 | 1.2081 | 0.233061 | 0.116531 |
| M9 | 0.210503434840562 | 0.295128 | 0.7133 | 0.479211 | 0.239605 |
| M10 | 0.00135240438839345 | 0.295064 | 0.0046 | 0.996362 | 0.498181 |
| M11 | 0.121352404388393 | 0.295064 | 0.4113 | 0.68274 | 0.34137 |
| Multiple Linear Regression - Regression Statistics | |
| Multiple R | 0.628606041061476 |
| R-squared | 0.395145554858983 |
| Adjusted R-squared | 0.240714632695319 |
| F-TEST (value) | 2.55872042543534 |
| F-TEST (DF numerator) | 12 |
| F-TEST (DF denominator) | 47 |
| p-value | 0.0107957637171796 |
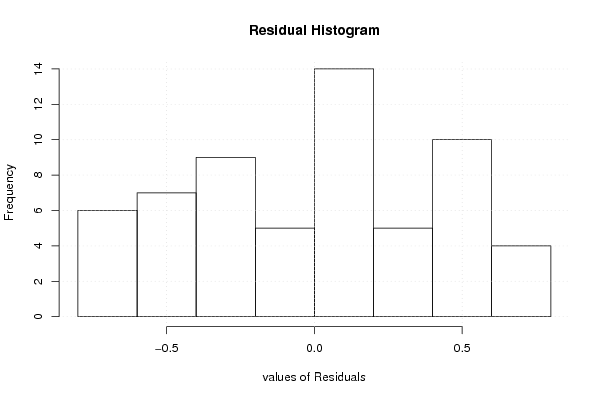
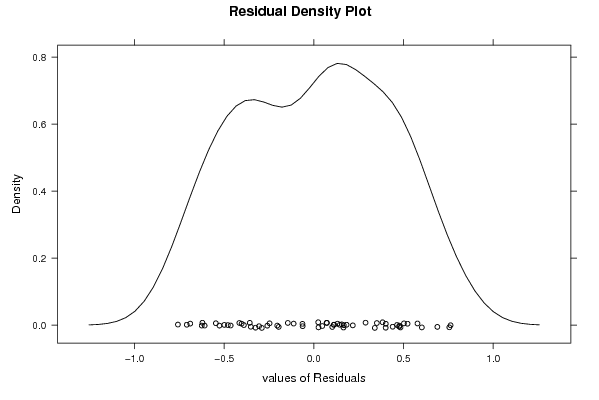
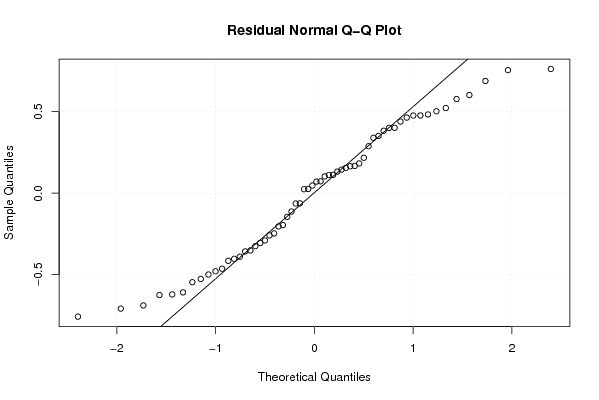
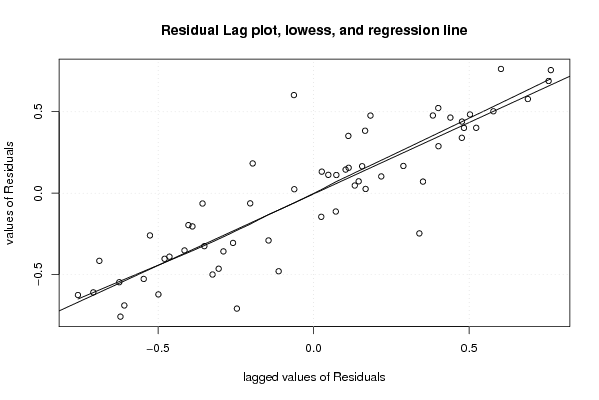
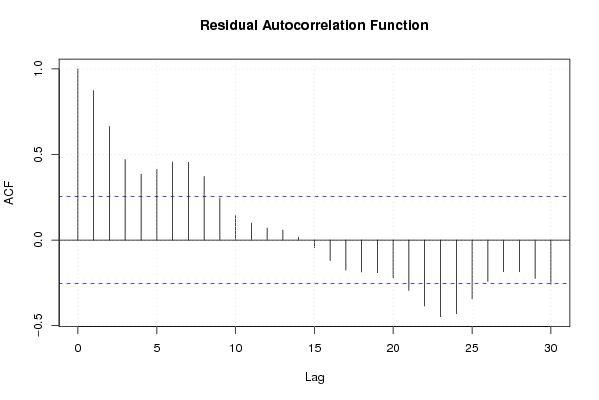
| Multiple Linear Regression - Residual Statistics | |
| Residual Standard Deviation | 0.466438941307066 |
| Sum Squared Residuals | 10.2255684404798 |
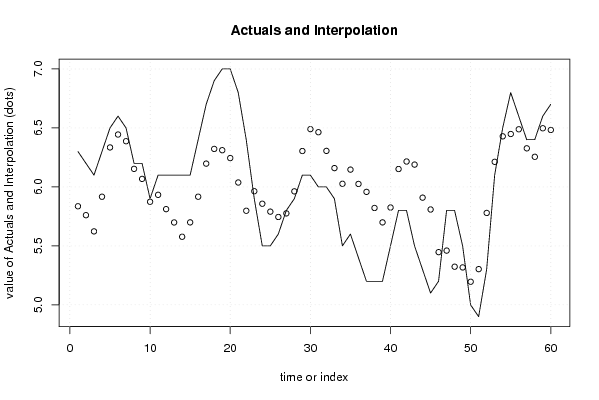
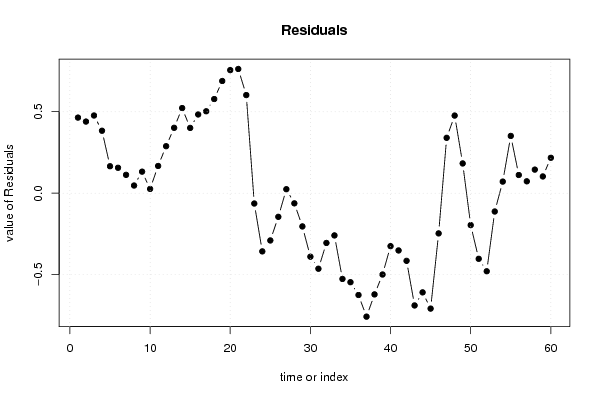
| Multiple Linear Regression - Actuals, Interpolation, and Residuals | |||
| Time or Index | Actuals | Interpolation Forecast | Residuals Prediction Error |
| 1 | 6.3 | 5.83591305239414 | 0.464086947605858 |
| 2 | 6.2 | 5.76031580026658 | 0.439684199733416 |
| 3 | 6.1 | 5.62305034348406 | 0.476949656515944 |
| 4 | 6.3 | 5.91660412180867 | 0.383395878191325 |
| 5 | 6.5 | 6.33456064800574 | 0.165439351994258 |
| 6 | 6.6 | 6.44405721316518 | 0.155942786834820 |
| 7 | 6.5 | 6.3874530913565 | 0.112546908643494 |
| 8 | 6.2 | 6.15289244335076 | 0.0471075566492364 |
| 9 | 6.2 | 6.06779862606377 | 0.132201373936225 |
| 10 | 5.9 | 5.87389931303189 | 0.0261006869681122 |
| 11 | 6.1 | 5.93289244335076 | 0.167107556649236 |
| 12 | 6.1 | 5.81154003896237 | 0.288459961037629 |
| 13 | 6.1 | 5.69864759561160 | 0.401352404388395 |
| 14 | 6.1 | 5.57729519122321 | 0.522704808776786 |
| 15 | 6.1 | 5.69930893058546 | 0.400691069414539 |
| 16 | 6.4 | 5.91660412180867 | 0.483395878191326 |
| 17 | 6.7 | 6.19729519122321 | 0.502704808776787 |
| 18 | 6.9 | 6.32204347380293 | 0.577956526197068 |
| 19 | 7 | 6.3111945042551 | 0.688805495744899 |
| 20 | 7 | 6.24440274787245 | 0.75559725212755 |
| 21 | 6.8 | 6.03729519122321 | 0.762704808776786 |
| 22 | 6.4 | 5.79764072593048 | 0.602359274069517 |
| 23 | 5.9 | 5.96339587819133 | -0.0633958781913254 |
| 24 | 5.5 | 5.85729519122321 | -0.357295191223213 |
| 25 | 5.5 | 5.79015790013329 | -0.290157900133291 |
| 26 | 5.6 | 5.74506408284630 | -0.145064082846304 |
| 27 | 5.8 | 5.77556751768687 | 0.0244324823131342 |
| 28 | 5.9 | 5.96235927406952 | -0.0623592740695169 |
| 29 | 6.1 | 6.30405721316518 | -0.20405721316518 |
| 30 | 6.1 | 6.48981236542602 | -0.389812365426023 |
| 31 | 6 | 6.46371167845791 | -0.46371167845791 |
| 32 | 6 | 6.30540961755357 | -0.305409617553573 |
| 33 | 5.9 | 6.15930893058546 | -0.259308930585461 |
| 34 | 5.5 | 6.0264164872347 | -0.526416487234697 |
| 35 | 5.6 | 6.1464164872347 | -0.546416487234697 |
| 36 | 5.4 | 6.0250640828463 | -0.625064082846303 |
| 37 | 5.2 | 5.95792679175638 | -0.757926791756381 |
| 38 | 5.2 | 5.82132266994771 | -0.621322669947708 |
| 39 | 5.2 | 5.69930893058546 | -0.499308930585461 |
| 40 | 5.5 | 5.82509381728699 | -0.325093817286989 |
| 41 | 5.8 | 6.15154003896237 | -0.35154003896237 |
| 42 | 5.8 | 6.21528145186097 | -0.415281451860966 |
| 43 | 5.5 | 6.18918076489285 | -0.689180764892853 |
| 44 | 5.3 | 5.90886496462627 | -0.608864964626269 |
| 45 | 5.1 | 5.808519429919 | -0.708519429919 |
| 46 | 5.2 | 5.44685122526402 | -0.246851225264022 |
| 47 | 5.8 | 5.46008920332205 | 0.339910796677945 |
| 48 | 5.8 | 5.32348508151338 | 0.47651491848662 |
| 49 | 5.5 | 5.31735466010458 | 0.182645339895419 |
| 50 | 5 | 5.19600225571619 | -0.196002255716190 |
| 51 | 4.9 | 5.30276427765816 | -0.402764277658156 |
| 52 | 5.3 | 5.77933866502615 | -0.479338665026146 |
| 53 | 6.1 | 6.21254690864349 | -0.112546908643494 |
| 54 | 6.5 | 6.4288054957449 | 0.0711945042551012 |
| 55 | 6.8 | 6.44845996103763 | 0.351540038962371 |
| 56 | 6.6 | 6.48843022659694 | 0.111569773403055 |
| 57 | 6.4 | 6.32707782220855 | 0.0729221777914492 |
| 58 | 6.4 | 6.25519224853891 | 0.144807751461089 |
| 59 | 6.6 | 6.49720598790116 | 0.102794012098841 |
| 60 | 6.7 | 6.48261560545473 | 0.217384394545268 |
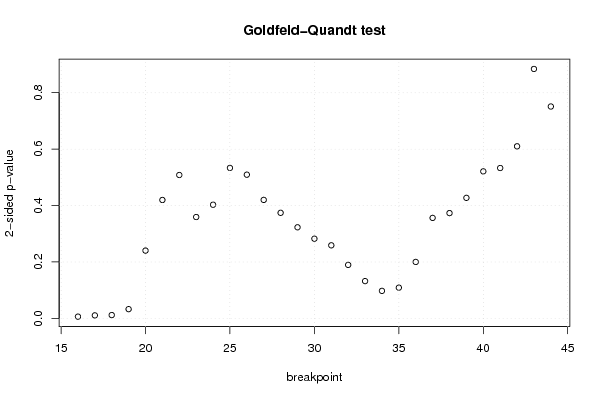
| Goldfeld-Quandt test for Heteroskedasticity | |||
| p-values | Alternative Hypothesis | ||
| breakpoint index | greater | 2-sided | less |
| 16 | 0.00309211620128038 | 0.00618423240256075 | 0.99690788379872 |
| 17 | 0.00534768310540459 | 0.0106953662108092 | 0.994652316894595 |
| 18 | 0.00588299899517326 | 0.0117659979903465 | 0.994117001004827 |
| 19 | 0.0163656929660110 | 0.0327313859320219 | 0.98363430703399 |
| 20 | 0.120155446281536 | 0.240310892563072 | 0.879844553718464 |
| 21 | 0.209880556211888 | 0.419761112423776 | 0.790119443788112 |
| 22 | 0.2541419354762 | 0.5082838709524 | 0.7458580645238 |
| 23 | 0.179664626263758 | 0.359329252527517 | 0.820335373736242 |
| 24 | 0.201465522112346 | 0.402931044224693 | 0.798534477887654 |
| 25 | 0.266658919580729 | 0.533317839161459 | 0.733341080419271 |
| 26 | 0.254711954834687 | 0.509423909669374 | 0.745288045165313 |
| 27 | 0.210011531962875 | 0.42002306392575 | 0.789988468037125 |
| 28 | 0.187143469656072 | 0.374286939312144 | 0.812856530343928 |
| 29 | 0.161454716602238 | 0.322909433204475 | 0.838545283397762 |
| 30 | 0.141258312257191 | 0.282516624514383 | 0.858741687742809 |
| 31 | 0.129517209870464 | 0.259034419740927 | 0.870482790129536 |
| 32 | 0.0948208803502078 | 0.189641760700416 | 0.905179119649792 |
| 33 | 0.066136950491216 | 0.132273900982432 | 0.933863049508784 |
| 34 | 0.0487900035867754 | 0.0975800071735507 | 0.951209996413225 |
| 35 | 0.0544826173602174 | 0.108965234720435 | 0.945517382639783 |
| 36 | 0.100075186363992 | 0.200150372727984 | 0.899924813636008 |
| 37 | 0.178115869766584 | 0.356231739533168 | 0.821884130233416 |
| 38 | 0.186640466988234 | 0.373280933976468 | 0.813359533011766 |
| 39 | 0.213659292770778 | 0.427318585541557 | 0.786340707229222 |
| 40 | 0.260583465971348 | 0.521166931942697 | 0.739416534028652 |
| 41 | 0.266544854658373 | 0.533089709316745 | 0.733455145341627 |
| 42 | 0.304999912575393 | 0.609999825150786 | 0.695000087424607 |
| 43 | 0.55788726683249 | 0.884225466335019 | 0.442112733167509 |
| 44 | 0.624439820063559 | 0.751120359872882 | 0.375560179936441 |
| Meta Analysis of Goldfeld-Quandt test for Heteroskedasticity | |||
| Description | # significant tests | % significant tests | OK/NOK |
| 1% type I error level | 1 | 0.0344827586206897 | NOK |
| 5% type I error level | 4 | 0.137931034482759 | NOK |
| 10% type I error level | 5 | 0.172413793103448 | NOK |