| Multiple Linear Regression - Estimated Regression Equation |
| WMan>25[t] = + 6.59619621729017 -0.1480526479753Infl[t] -0.202067711946028M1[t] -0.297369689987745M2[t] -0.286749562110452M3[t] -0.042778910868714M4[t] + 0.324880164049072M5[t] + 0.460695027128835M6[t] + 0.460198313884645M7[t] + 0.313052124004902M8[t] + 0.177750145963182M9[t] -0.0205128850380429M10[t] + 0.110107242839249M11[t] -0.0106201278772925t + e[t] |
| Multiple Linear Regression - Ordinary Least Squares | |||||
| Variable | Parameter | S.D. | T-STAT H0: parameter = 0 | 2-tail p-value | 1-tail p-value |
| (Intercept) | 6.59619621729017 | 0.236136 | 27.9338 | 0 | 0 |
| Infl | -0.1480526479753 | 0.039238 | -3.7732 | 0.00046 | 0.00023 |
| M1 | -0.202067711946028 | 0.271928 | -0.7431 | 0.461204 | 0.230602 |
| M2 | -0.297369689987745 | 0.271368 | -1.0958 | 0.278862 | 0.139431 |
| M3 | -0.286749562110452 | 0.270993 | -1.0581 | 0.295515 | 0.147757 |
| M4 | -0.042778910868714 | 0.27011 | -0.1584 | 0.874854 | 0.437427 |
| M5 | 0.324880164049072 | 0.269764 | 1.2043 | 0.234629 | 0.117315 |
| M6 | 0.460695027128835 | 0.269296 | 1.7107 | 0.093867 | 0.046933 |
| M7 | 0.460198313884645 | 0.269197 | 1.7095 | 0.094093 | 0.047046 |
| M8 | 0.313052124004902 | 0.268802 | 1.1646 | 0.250178 | 0.125089 |
| M9 | 0.177750145963182 | 0.26861 | 0.6617 | 0.511439 | 0.25572 |
| M10 | -0.0205128850380429 | 0.268449 | -0.0764 | 0.939422 | 0.469711 |
| M11 | 0.110107242839249 | 0.268389 | 0.4103 | 0.683525 | 0.341763 |
| t | -0.0106201278772925 | 0.003229 | -3.2888 | 0.001934 | 0.000967 |
| Multiple Linear Regression - Regression Statistics | |
| Multiple R | 0.714346509058098 |
| R-squared | 0.510290935003491 |
| Adjusted R-squared | 0.371894894895783 |
| F-TEST (value) | 3.68717872712506 |
| F-TEST (DF numerator) | 13 |
| F-TEST (DF denominator) | 46 |
| p-value | 0.000506791225271641 |
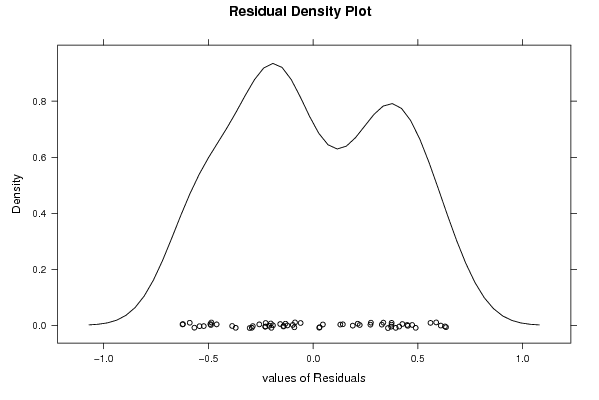
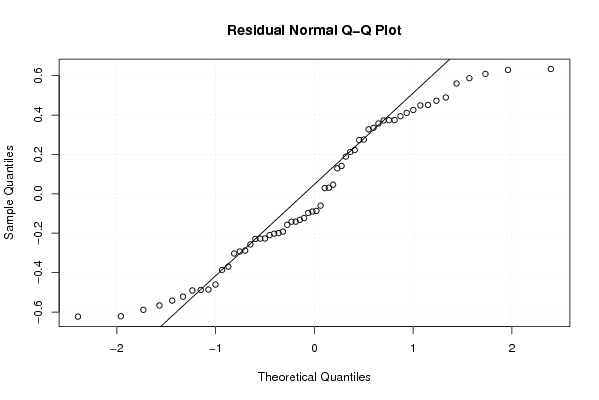
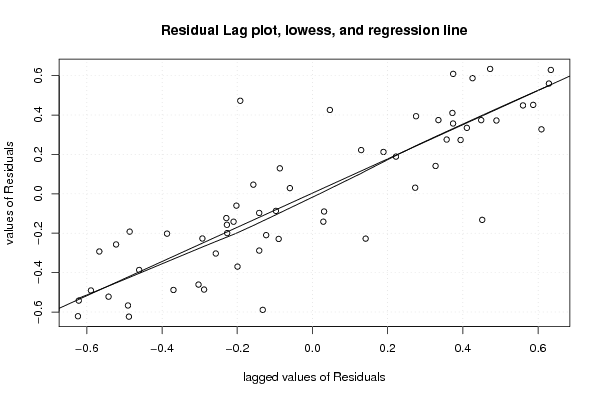
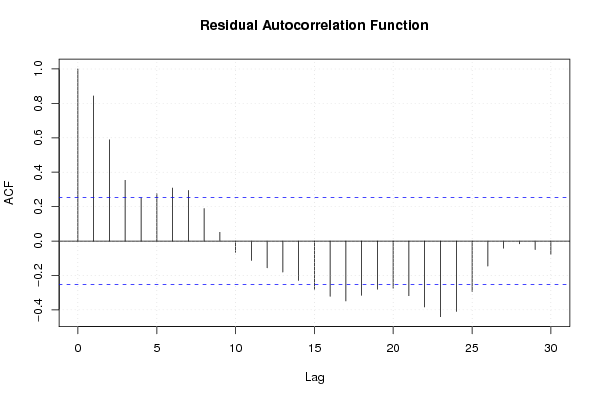
| Multiple Linear Regression - Residual Statistics | |
| Residual Standard Deviation | 0.424236906606732 |
| Sum Squared Residuals | 8.27893983465347 |
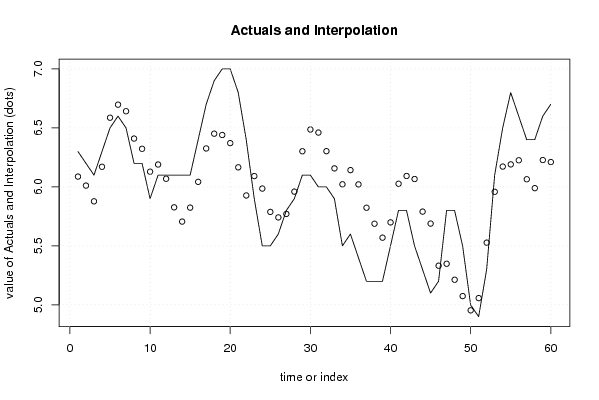
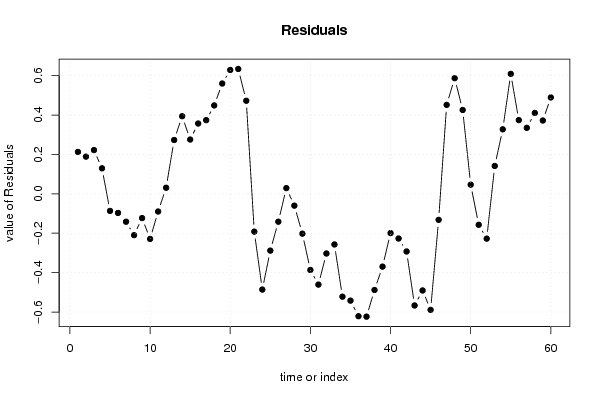
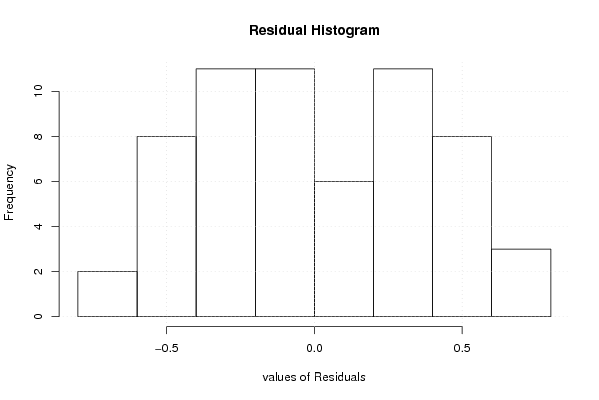
| Multiple Linear Regression - Actuals, Interpolation, and Residuals | |||
| Time or Index | Actuals | Interpolation Forecast | Residuals Prediction Error |
| 1 | 6.3 | 6.08740308151626 | 0.212596918483744 |
| 2 | 6.2 | 6.0110915051923 | 0.188908494807704 |
| 3 | 6.1 | 5.87784412201453 | 0.222155877985473 |
| 4 | 6.3 | 6.17041570456909 | 0.129584295430907 |
| 5 | 6.5 | 6.58667571079971 | -0.086675710799707 |
| 6 | 6.6 | 6.69706518120465 | -0.0970651812046475 |
| 7 | 6.5 | 6.64153254569058 | -0.141532545690575 |
| 8 | 6.2 | 6.40973990394589 | -0.209739903945889 |
| 9 | 6.2 | 6.323038857217 | -0.123038857216996 |
| 10 | 5.9 | 6.12896096313601 | -0.228960963136009 |
| 11 | 6.1 | 6.18973990394589 | -0.0897399039458891 |
| 12 | 6.1 | 6.06901253322935 | 0.0309874667706529 |
| 13 | 6.1 | 5.82671416381097 | 0.273285836189033 |
| 14 | 6.1 | 5.70598679309443 | 0.394013206905573 |
| 15 | 6.1 | 5.82442891147467 | 0.275571088525333 |
| 16 | 6.4 | 6.04297417004158 | 0.357025829958418 |
| 17 | 6.7 | 6.32598679309443 | 0.374013206905574 |
| 18 | 6.9 | 6.4511815282969 | 0.448818471703104 |
| 19 | 7 | 6.44006468717541 | 0.559935312824586 |
| 20 | 7 | 6.37112995820356 | 0.628870041796442 |
| 21 | 6.8 | 6.16598679309443 | 0.634013206905573 |
| 22 | 6.4 | 5.92749310462085 | 0.472506895379152 |
| 23 | 5.9 | 6.09190889901344 | -0.191908899013438 |
| 24 | 5.5 | 5.98598679309443 | -0.485986793094426 |
| 25 | 5.5 | 5.78810421806864 | -0.288104218068636 |
| 26 | 5.6 | 5.74140317133975 | -0.141403171339746 |
| 27 | 5.8 | 5.7710137009348 | 0.0289862990651938 |
| 28 | 5.9 | 5.95994842990666 | -0.0599484299066617 |
| 29 | 6.1 | 6.30218211214963 | -0.202182112149626 |
| 30 | 6.1 | 6.48659790654222 | -0.386597906542216 |
| 31 | 6 | 6.4606758006232 | -0.460675800623204 |
| 32 | 6 | 6.30290948286617 | -0.302909482866168 |
| 33 | 5.9 | 6.15698737694716 | -0.256987376947156 |
| 34 | 5.5 | 6.02213054205629 | -0.522130542056288 |
| 35 | 5.6 | 6.14213054205629 | -0.542130542056288 |
| 36 | 5.4 | 6.02140317133975 | -0.621403171339746 |
| 37 | 5.2 | 5.82352059631396 | -0.623520596313956 |
| 38 | 5.2 | 5.68798796079989 | -0.487987960799885 |
| 39 | 5.2 | 5.56954584241965 | -0.369545842419645 |
| 40 | 5.5 | 5.69925951220138 | -0.199259512201382 |
| 41 | 5.8 | 6.02668792964682 | -0.226687929646815 |
| 42 | 5.8 | 6.09266160565917 | -0.292661605659166 |
| 43 | 5.5 | 6.06673949974015 | -0.566739499740154 |
| 44 | 5.3 | 5.79053106360288 | -0.490531063602878 |
| 45 | 5.1 | 5.68902475207646 | -0.589024752076456 |
| 46 | 5.2 | 5.33208894522264 | -0.132088945222638 |
| 47 | 5.8 | 5.34845209163993 | 0.451547908360072 |
| 48 | 5.8 | 5.21291945612586 | 0.587080543874144 |
| 49 | 5.5 | 5.07425794029019 | 0.425742059709814 |
| 50 | 5 | 4.95353056957364 | 0.0464694304263549 |
| 51 | 4.9 | 5.05716742315636 | -0.157167423156355 |
| 52 | 5.3 | 5.52740218328128 | -0.227402183281281 |
| 53 | 6.1 | 5.95846745430942 | 0.141532545690575 |
| 54 | 6.5 | 6.17249377829708 | 0.327506221702925 |
| 55 | 6.8 | 6.19098746677065 | 0.609012533229347 |
| 56 | 6.6 | 6.2256895913815 | 0.374310408618493 |
| 57 | 6.4 | 6.06496222066496 | 0.335037779335035 |
| 58 | 6.4 | 5.98932644496422 | 0.410673555035783 |
| 59 | 6.6 | 6.22776856334446 | 0.372231436655543 |
| 60 | 6.7 | 6.21067804621063 | 0.489321953789375 |
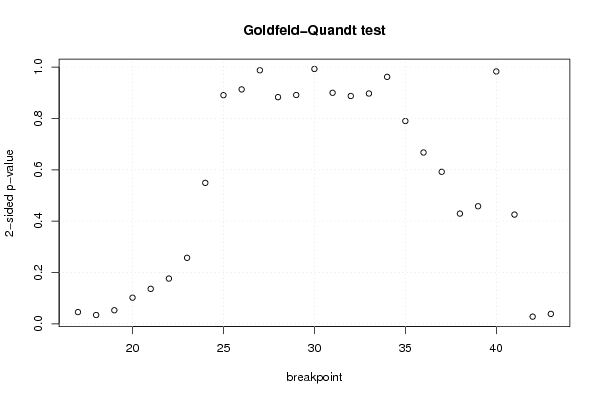
| Goldfeld-Quandt test for Heteroskedasticity | |||
| p-values | Alternative Hypothesis | ||
| breakpoint index | greater | 2-sided | less |
| 17 | 0.0228237385891184 | 0.0456474771782368 | 0.977176261410882 |
| 18 | 0.0170870224254627 | 0.0341740448509254 | 0.982912977574537 |
| 19 | 0.0263743178267607 | 0.0527486356535213 | 0.97362568217324 |
| 20 | 0.050910110264536 | 0.101820220529072 | 0.949089889735464 |
| 21 | 0.0680921184520517 | 0.136184236904103 | 0.931907881547948 |
| 22 | 0.0880984262143142 | 0.176196852428628 | 0.911901573785686 |
| 23 | 0.128496283092188 | 0.256992566184375 | 0.871503716907812 |
| 24 | 0.274534680392768 | 0.549069360785535 | 0.725465319607232 |
| 25 | 0.445323216724325 | 0.89064643344865 | 0.554676783275675 |
| 26 | 0.45659819856532 | 0.91319639713064 | 0.54340180143468 |
| 27 | 0.49387995294783 | 0.98775990589566 | 0.50612004705217 |
| 28 | 0.558483191378076 | 0.883033617243849 | 0.441516808621924 |
| 29 | 0.554332291922516 | 0.891335416154967 | 0.445667708077484 |
| 30 | 0.503571043374252 | 0.992857913251496 | 0.496428956625748 |
| 31 | 0.449963312095454 | 0.899926624190908 | 0.550036687904546 |
| 32 | 0.443758464526993 | 0.887516929053986 | 0.556241535473007 |
| 33 | 0.55145353521146 | 0.89709292957708 | 0.44854646478854 |
| 34 | 0.481007851065149 | 0.962015702130297 | 0.518992148934851 |
| 35 | 0.394998133622609 | 0.789996267245218 | 0.605001866377391 |
| 36 | 0.333688748381936 | 0.667377496763871 | 0.666311251618064 |
| 37 | 0.296074091495032 | 0.592148182990063 | 0.703925908504968 |
| 38 | 0.214623283452552 | 0.429246566905105 | 0.785376716547448 |
| 39 | 0.22898359763709 | 0.45796719527418 | 0.77101640236291 |
| 40 | 0.508449766939761 | 0.983100466120478 | 0.491550233060239 |
| 41 | 0.787227727542107 | 0.425544544915787 | 0.212772272457893 |
| 42 | 0.98609118224482 | 0.0278176355103586 | 0.0139088177551793 |
| 43 | 0.980742358854364 | 0.0385152822912712 | 0.0192576411456356 |
| Meta Analysis of Goldfeld-Quandt test for Heteroskedasticity | |||
| Description | # significant tests | % significant tests | OK/NOK |
| 1% type I error level | 0 | 0 | OK |
| 5% type I error level | 4 | 0.148148148148148 | NOK |
| 10% type I error level | 5 | 0.185185185185185 | NOK |