| Multiple Linear Regression - Estimated Regression Equation |
| werkloos[t] = + 488516.201404741 + 15.3370721803531bouw[t] + e[t] |
| Multiple Linear Regression - Ordinary Least Squares | |||||
| Variable | Parameter | S.D. | T-STAT H0: parameter = 0 | 2-tail p-value | 1-tail p-value |
| (Intercept) | 488516.201404741 | 41966.856697 | 11.6405 | 0 | 0 |
| bouw | 15.3370721803531 | 8.962499 | 1.7112 | 0.092379 | 0.046189 |
| Multiple Linear Regression - Regression Statistics | |
| Multiple R | 0.219231804110551 |
| R-squared | 0.048062583933567 |
| Adjusted R-squared | 0.0316498698634563 |
| F-TEST (value) | 2.92837514430922 |
| F-TEST (DF numerator) | 1 |
| F-TEST (DF denominator) | 58 |
| p-value | 0.092378639331489 |
| Multiple Linear Regression - Residual Statistics | |
| Residual Standard Deviation | 41300.4629313393 |
| Sum Squared Residuals | 98932237823.8902 |
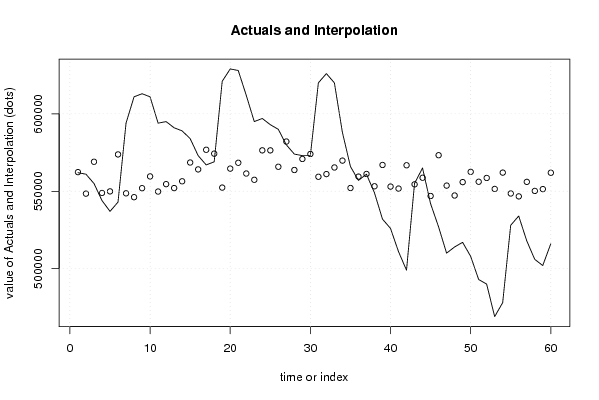
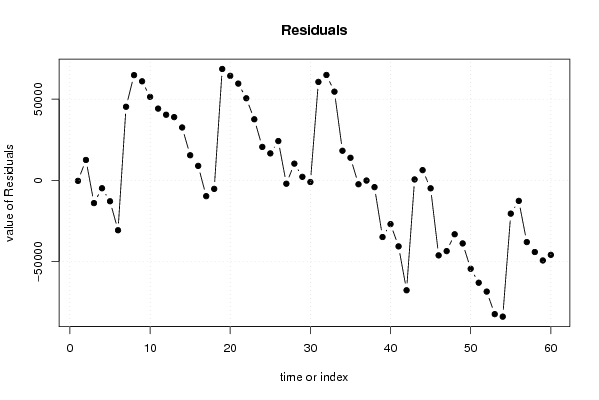
| Multiple Linear Regression - Actuals, Interpolation, and Residuals | |||
| Time or Index | Actuals | Interpolation Forecast | Residuals Prediction Error |
| 1 | 562000 | 562348.866880961 | -348.866880960755 |
| 2 | 561000 | 548453.479485561 | 12546.5205144391 |
| 3 | 555000 | 569035.830351595 | -14035.8303515948 |
| 4 | 544000 | 548898.254578791 | -4898.25457879115 |
| 5 | 537000 | 549925.838414875 | -12925.8384148748 |
| 6 | 543000 | 573790.322727504 | -30790.3227275043 |
| 7 | 594000 | 548668.198496086 | 45331.8015039141 |
| 8 | 611000 | 546168.255730688 | 64831.7442693117 |
| 9 | 613000 | 551981.006087042 | 61018.9939129579 |
| 10 | 611000 | 559588.193888497 | 51411.8061115027 |
| 11 | 594000 | 549803.141837432 | 44196.858162568 |
| 12 | 595000 | 554588.308357702 | 40411.6916422978 |
| 13 | 591000 | 552057.691447944 | 38942.3085520561 |
| 14 | 589000 | 556444.094091525 | 32555.9059084751 |
| 15 | 584000 | 568560.381114004 | 15439.6188859962 |
| 16 | 573000 | 564112.630181701 | 8887.36981829856 |
| 17 | 567000 | 576781.051802673 | -9781.05180267312 |
| 18 | 569000 | 574281.109037276 | -5281.10903727556 |
| 19 | 621000 | 552364.432891551 | 68635.567108449 |
| 20 | 629000 | 564618.753563653 | 64381.2464363469 |
| 21 | 628000 | 568391.67332002 | 59608.32667998 |
| 22 | 612000 | 561443.97962232 | 50556.02037768 |
| 23 | 595000 | 557394.992566707 | 37605.0074332932 |
| 24 | 597000 | 576428.299142525 | 20571.700857475 |
| 25 | 593000 | 576412.962070345 | 16587.0379296554 |
| 26 | 590000 | 565815.045193721 | 24184.9548062794 |
| 27 | 580000 | 582103.015849256 | -2103.01584925565 |
| 28 | 574000 | 563729.203377193 | 10270.7966228074 |
| 29 | 573000 | 570860.941941057 | 2139.05805894318 |
| 30 | 573000 | 574066.390026751 | -1066.39002675061 |
| 31 | 620000 | 559358.137805792 | 60641.862194208 |
| 32 | 626000 | 561075.889889991 | 64924.1101100085 |
| 33 | 620000 | 565370.27010049 | 54629.7298995096 |
| 34 | 588000 | 569787.346888432 | 18212.6531115679 |
| 35 | 566000 | 552103.702664485 | 13896.2973355150 |
| 36 | 557000 | 559450.160238874 | -2450.16023887410 |
| 37 | 561000 | 561152.575250893 | -152.575250893292 |
| 38 | 549000 | 553223.308933651 | -4223.30893365073 |
| 39 | 532000 | 566980.662679428 | -34980.6626794275 |
| 40 | 526000 | 553008.589923126 | -27008.5899231258 |
| 41 | 511000 | 551720.275859976 | -40720.2758599761 |
| 42 | 499000 | 566781.280741083 | -67781.2807410829 |
| 43 | 555000 | 554465.611780259 | 534.388219740667 |
| 44 | 565000 | 558729.317846398 | 6270.6821536025 |
| 45 | 542000 | 546935.109339706 | -4935.10933970595 |
| 46 | 527000 | 573268.862273372 | -46268.8622733723 |
| 47 | 510000 | 553652.746954701 | -43652.7469547006 |
| 48 | 514000 | 547257.187855493 | -33257.1878554934 |
| 49 | 517000 | 555907.296565213 | -38907.2965652125 |
| 50 | 508000 | 562532.911747125 | -54532.9117471251 |
| 51 | 493000 | 556137.352647918 | -63137.3526479178 |
| 52 | 490000 | 558591.284196774 | -68591.2841967743 |
| 53 | 469000 | 551490.219777271 | -82490.2197772708 |
| 54 | 478000 | 562042.125437354 | -84042.1254373538 |
| 55 | 528000 | 548545.501918643 | -20545.5019186430 |
| 56 | 534000 | 546689.71618482 | -12689.7161848203 |
| 57 | 518000 | 556076.004359196 | -38076.0043591964 |
| 58 | 506000 | 550201.905714121 | -44201.9057141212 |
| 59 | 502000 | 551398.197344189 | -49398.1973441887 |
| 60 | 516000 | 561950.103004272 | -45950.1030042717 |
| Goldfeld-Quandt test for Heteroskedasticity | |||
| p-values | Alternative Hypothesis | ||
| breakpoint index | greater | 2-sided | less |
| 5 | 0.0238612080185290 | 0.0477224160370579 | 0.976138791981471 |
| 6 | 0.00972799458309202 | 0.0194559891661840 | 0.990272005416908 |
| 7 | 0.0464965833602371 | 0.0929931667204743 | 0.953503416639763 |
| 8 | 0.098212520964649 | 0.196425041929298 | 0.901787479035351 |
| 9 | 0.144884927917828 | 0.289769855835656 | 0.855115072082172 |
| 10 | 0.19185243027512 | 0.38370486055024 | 0.80814756972488 |
| 11 | 0.143848268635712 | 0.287696537271425 | 0.856151731364288 |
| 12 | 0.111438789085268 | 0.222877578170536 | 0.888561210914732 |
| 13 | 0.0803994579707372 | 0.160798915941474 | 0.919600542029263 |
| 14 | 0.0566418802030706 | 0.113283760406141 | 0.94335811979693 |
| 15 | 0.0393140835397738 | 0.0786281670795475 | 0.960685916460226 |
| 16 | 0.0227052458460962 | 0.0454104916921924 | 0.977294754153904 |
| 17 | 0.0129673442263009 | 0.0259346884526017 | 0.9870326557737 |
| 18 | 0.00701518305867721 | 0.0140303661173544 | 0.992984816941323 |
| 19 | 0.0149572642986173 | 0.0299145285972346 | 0.985042735701383 |
| 20 | 0.0434624306471477 | 0.0869248612942953 | 0.956537569352852 |
| 21 | 0.0848439850356229 | 0.169687970071246 | 0.915156014964377 |
| 22 | 0.0985147187396507 | 0.197029437479301 | 0.90148528126035 |
| 23 | 0.0916069423934336 | 0.183213884786867 | 0.908393057606566 |
| 24 | 0.0705349837382687 | 0.141069967476537 | 0.929465016261731 |
| 25 | 0.0506045160752431 | 0.101209032150486 | 0.949395483924757 |
| 26 | 0.0391666901589556 | 0.0783333803179112 | 0.960833309841044 |
| 27 | 0.0250953133860427 | 0.0501906267720854 | 0.974904686613957 |
| 28 | 0.0180747671576925 | 0.0361495343153849 | 0.981925232842308 |
| 29 | 0.0118389664032760 | 0.0236779328065520 | 0.988161033596724 |
| 30 | 0.00739454594264101 | 0.0147890918852820 | 0.99260545405736 |
| 31 | 0.0208647843983368 | 0.0417295687966736 | 0.979135215601663 |
| 32 | 0.0854796096387801 | 0.170959219277560 | 0.91452039036122 |
| 33 | 0.265182206299276 | 0.530364412598552 | 0.734817793700724 |
| 34 | 0.382606670601138 | 0.765213341202276 | 0.617393329398862 |
| 35 | 0.459418522884119 | 0.918837045768239 | 0.540581477115881 |
| 36 | 0.524749839413454 | 0.950500321173091 | 0.475250160586546 |
| 37 | 0.624291002645896 | 0.751417994708209 | 0.375708997354104 |
| 38 | 0.687487492693247 | 0.625025014613507 | 0.312512507306753 |
| 39 | 0.73612854667853 | 0.527742906642941 | 0.263871453321471 |
| 40 | 0.766080047913982 | 0.467839904172036 | 0.233919952086018 |
| 41 | 0.805542454016674 | 0.388915091966652 | 0.194457545983326 |
| 42 | 0.853730220286336 | 0.292539559427328 | 0.146269779713664 |
| 43 | 0.890534400284593 | 0.218931199430814 | 0.109465599715407 |
| 44 | 0.968309175090245 | 0.063381649819511 | 0.0316908249097555 |
| 45 | 0.97712358748501 | 0.0457528250299821 | 0.0228764125149911 |
| 46 | 0.986985838383188 | 0.0260283232336243 | 0.0130141616168122 |
| 47 | 0.982004163128245 | 0.0359916737435094 | 0.0179958368717547 |
| 48 | 0.971899832111798 | 0.0562003357764031 | 0.0281001678882015 |
| 49 | 0.961652366175217 | 0.0766952676495656 | 0.0383476338247828 |
| 50 | 0.951538350789533 | 0.0969232984209348 | 0.0484616492104674 |
| 51 | 0.930093760011085 | 0.139812479977830 | 0.0699062399889152 |
| 52 | 0.89683133290427 | 0.206337334191461 | 0.103168667095730 |
| 53 | 0.97467438565755 | 0.0506512286849017 | 0.0253256143424509 |
| 54 | 0.981960317351218 | 0.0360793652975649 | 0.0180396826487824 |
| 55 | 0.94937784828764 | 0.101244303424722 | 0.050622151712361 |
| Meta Analysis of Goldfeld-Quandt test for Heteroskedasticity | |||
| Description | # significant tests | % significant tests | OK/NOK |
| 1% type I error level | 0 | 0 | OK |
| 5% type I error level | 14 | 0.274509803921569 | NOK |
| 10% type I error level | 24 | 0.470588235294118 | NOK |