| Multiple Linear Regression - Estimated Regression Equation |
| InIEU[t] = -1948.67388499954 + 1.09340563842981UitIEU[t] + 680.954666143251M1[t] -339.002306844012M2[t] -549.314325483949M3[t] -182.982105215105M4[t] + 1117.86368062190M5[t] + 0.843927411887669M6[t] + 219.578218092053M7[t] + 95.2438411644369M8[t] -86.0400876151622M9[t] -73.2518239774703M10[t] -252.678919640362M11[t] + e[t] |
| Multiple Linear Regression - Ordinary Least Squares | |||||
| Variable | Parameter | S.D. | T-STAT H0: parameter = 0 | 2-tail p-value | 1-tail p-value |
| (Intercept) | -1948.67388499954 | 579.424605 | -3.3631 | 0.00154 | 0.00077 |
| UitIEU | 1.09340563842981 | 0.039943 | 27.3741 | 0 | 0 |
| M1 | 680.954666143251 | 263.504263 | 2.5842 | 0.012927 | 0.006463 |
| M2 | -339.002306844012 | 263.947151 | -1.2844 | 0.205312 | 0.102656 |
| M3 | -549.314325483949 | 266.737276 | -2.0594 | 0.045021 | 0.022511 |
| M4 | -182.982105215105 | 261.29276 | -0.7003 | 0.487195 | 0.243598 |
| M5 | 1117.86368062190 | 259.350339 | 4.3102 | 8.3e-05 | 4.1e-05 |
| M6 | 0.843927411887669 | 258.236303 | 0.0033 | 0.997406 | 0.498703 |
| M7 | 219.578218092053 | 258.242817 | 0.8503 | 0.399481 | 0.199741 |
| M8 | 95.2438411644369 | 267.10792 | 0.3566 | 0.723006 | 0.361503 |
| M9 | -86.0400876151622 | 259.217869 | -0.3319 | 0.741424 | 0.370712 |
| M10 | -73.2518239774703 | 258.904229 | -0.2829 | 0.778473 | 0.389236 |
| M11 | -252.678919640362 | 268.173097 | -0.9422 | 0.350896 | 0.175448 |
| Multiple Linear Regression - Regression Statistics | |
| Multiple R | 0.975955859594136 |
| R-squared | 0.952489839876129 |
| Adjusted R-squared | 0.94035958622748 |
| F-TEST (value) | 78.5218403064713 |
| F-TEST (DF numerator) | 12 |
| F-TEST (DF denominator) | 47 |
| p-value | 0 |
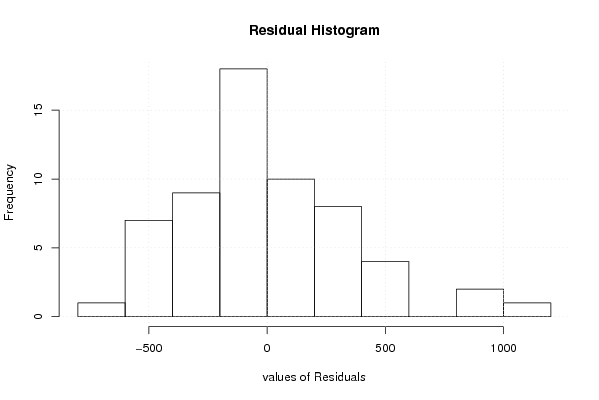
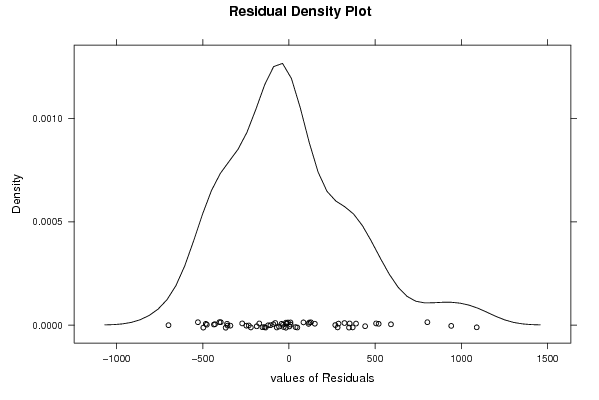
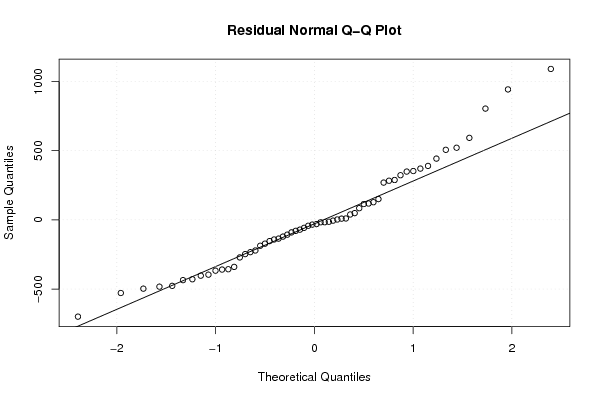
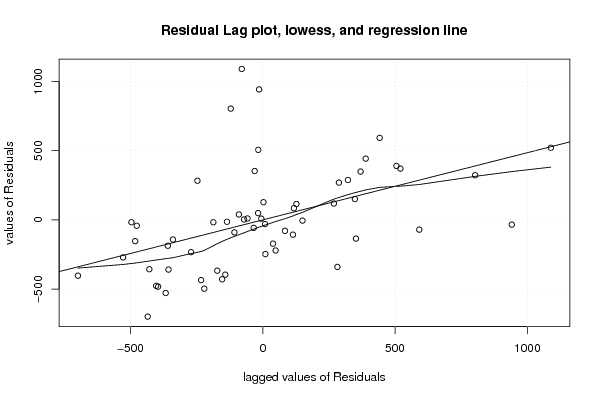
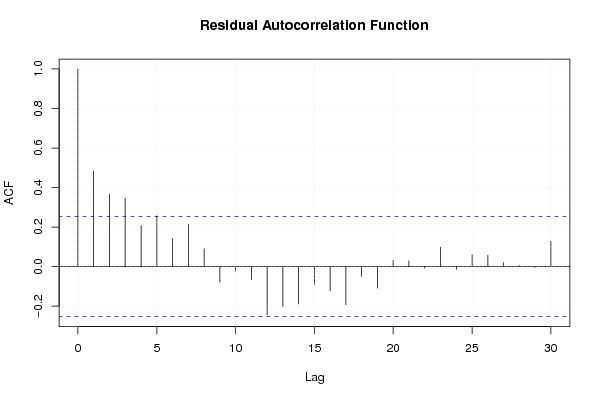
| Multiple Linear Regression - Residual Statistics | |
| Residual Standard Deviation | 408.111714102607 |
| Sum Squared Residuals | 7828093.0458251 |
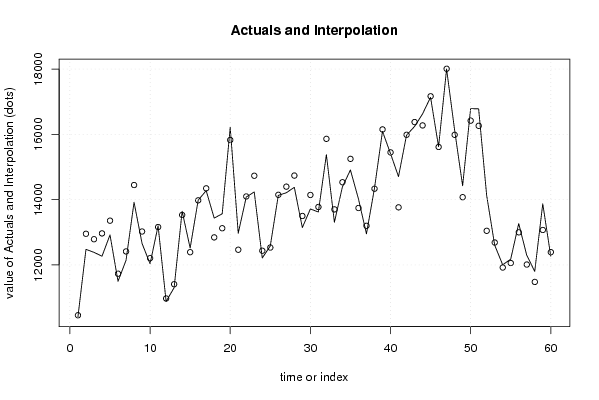
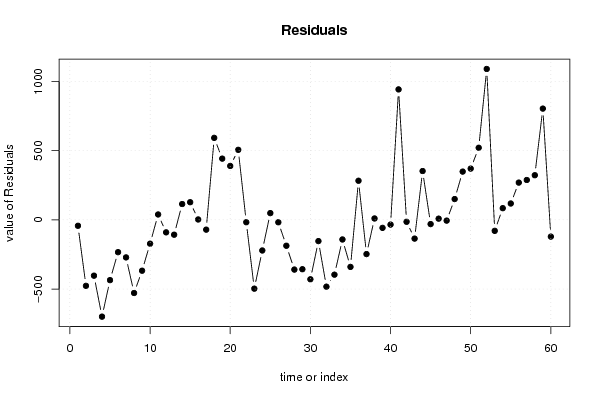
| Multiple Linear Regression - Actuals, Interpolation, and Residuals | |||
| Time or Index | Actuals | Interpolation Forecast | Residuals Prediction Error |
| 1 | 10414.9 | 10457.7441665374 | -42.8441665374268 |
| 2 | 12476.8 | 12953.1956616658 | -476.39566166579 |
| 3 | 12384.6 | 12787.6039336376 | -403.003933637635 |
| 4 | 12266.7 | 12965.4330218412 | -698.733021841177 |
| 5 | 12919.9 | 13354.9252080469 | -435.025208046931 |
| 6 | 11497.3 | 11730.4558980416 | -233.155898041644 |
| 7 | 12142 | 12413.1222011076 | -271.122201107582 |
| 8 | 13919.4 | 14447.3892355681 | -527.989235568103 |
| 9 | 12656.8 | 13023.7778204045 | -366.97782040455 |
| 10 | 12034.1 | 12206.1245016548 | -172.024501654797 |
| 11 | 13199.7 | 13160.8870747352 | 38.8129252648492 |
| 12 | 10881.3 | 10971.5538415064 | -90.2538415063668 |
| 13 | 11301.2 | 11408.3510285882 | -107.151028588239 |
| 14 | 13643.9 | 13529.7484548098 | 114.151545190165 |
| 15 | 12517 | 12389.7136218130 | 127.286378186975 |
| 16 | 13981.1 | 13978.4733458464 | 2.62665415359883 |
| 17 | 14275.7 | 14346.4254409751 | -70.7254409750882 |
| 18 | 13435 | 12843.2148162717 | 591.785183728333 |
| 19 | 13565.7 | 13123.7265255231 | 441.973474476884 |
| 20 | 16216.3 | 15827.1578107027 | 389.142189297312 |
| 21 | 12970 | 12464.5008363477 | 505.4991636523 |
| 22 | 14079.9 | 14096.9508721915 | -17.0508721914754 |
| 23 | 14235 | 14731.6736149034 | -496.673614903423 |
| 24 | 12213.4 | 12434.5305857255 | -221.130585725459 |
| 25 | 12581 | 12532.3720248941 | 48.6279751059106 |
| 26 | 14130.4 | 14147.9600027781 | -17.5600027780517 |
| 27 | 14210.8 | 14397.7530767894 | -186.953076789381 |
| 28 | 14378.5 | 14737.4061994805 | -358.906199480536 |
| 29 | 13142.8 | 13499.2547523197 | -356.454752319668 |
| 30 | 13714.7 | 14143.6021420562 | -428.902142056244 |
| 31 | 13621.9 | 13775.3962860273 | -153.496286027286 |
| 32 | 15379.8 | 15862.1467911324 | -482.346791132442 |
| 33 | 13306.3 | 13702.0173379226 | -395.717337922564 |
| 34 | 14391.2 | 14532.8917002334 | -141.691700233442 |
| 35 | 14909.9 | 15249.5105252638 | -339.610525263785 |
| 36 | 14025.4 | 13743.1184537983 | 282.28154620174 |
| 37 | 12951.2 | 13198.2560586978 | -247.056058697846 |
| 38 | 14344.3 | 14334.3856641303 | 9.91433586966418 |
| 39 | 16093.4 | 16151.1383585754 | -57.7383585754312 |
| 40 | 15413.6 | 15447.7918427684 | -34.1918427683873 |
| 41 | 14705.7 | 13764.1869385112 | 941.513061488788 |
| 42 | 15972.8 | 15986.6466861935 | -13.8466861935425 |
| 43 | 16241.4 | 16376.7176404157 | -135.317640415656 |
| 44 | 16626.4 | 16274.1420356928 | 352.257964307206 |
| 45 | 17136.2 | 17166.8011249790 | -30.6011249789598 |
| 46 | 15622.9 | 15614.2698766405 | 8.63012335947014 |
| 47 | 18003.9 | 18009.4850377883 | -5.58503778832015 |
| 48 | 16136.1 | 15986.0214399093 | 150.078560090663 |
| 49 | 14423.7 | 14075.2767212824 | 348.423278717601 |
| 50 | 16789.4 | 16419.510216616 | 369.889783384012 |
| 51 | 16782.2 | 16261.7910091845 | 520.408990815472 |
| 52 | 14133.8 | 13044.5955900635 | 1089.20440993650 |
| 53 | 12607 | 12686.3076601471 | -79.3076601471001 |
| 54 | 12004.5 | 11920.3804574369 | 84.119542563097 |
| 55 | 12175.4 | 12057.4373469264 | 117.962653073639 |
| 56 | 13268 | 12999.0641269040 | 268.935873096028 |
| 57 | 12299.3 | 12011.5028803462 | 287.797119653773 |
| 58 | 11800.6 | 11478.4630492798 | 322.136950720244 |
| 59 | 13873.3 | 13070.2437473093 | 803.05625269068 |
| 60 | 12269.6 | 12390.5756790606 | -120.975679060578 |
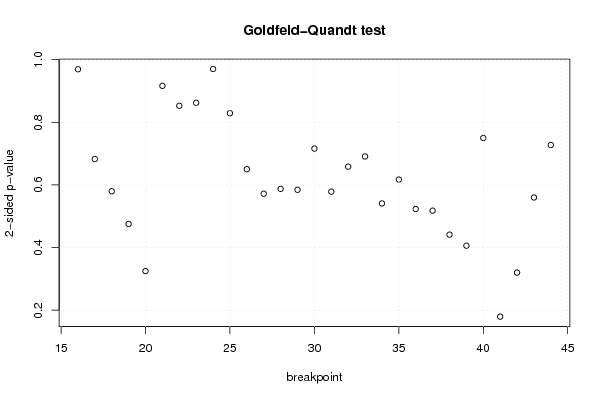
| Goldfeld-Quandt test for Heteroskedasticity | |||
| p-values | Alternative Hypothesis | ||
| breakpoint index | greater | 2-sided | less |
| 16 | 0.515261006459463 | 0.969477987081074 | 0.484738993540537 |
| 17 | 0.341434328654986 | 0.682868657309972 | 0.658565671345014 |
| 18 | 0.29002842099254 | 0.58005684198508 | 0.70997157900746 |
| 19 | 0.237738149649579 | 0.475476299299159 | 0.762261850350421 |
| 20 | 0.162428255792096 | 0.324856511584192 | 0.837571744207904 |
| 21 | 0.458295937002299 | 0.916591874004598 | 0.541704062997701 |
| 22 | 0.42642931539765 | 0.8528586307953 | 0.57357068460235 |
| 23 | 0.568820627237988 | 0.862358745524024 | 0.431179372762012 |
| 24 | 0.514766810729963 | 0.970466378540074 | 0.485233189270037 |
| 25 | 0.414558823434049 | 0.829117646868097 | 0.585441176565952 |
| 26 | 0.325233699454398 | 0.650467398908796 | 0.674766300545602 |
| 27 | 0.285961601221351 | 0.571923202442701 | 0.71403839877865 |
| 28 | 0.293794155887772 | 0.587588311775543 | 0.706205844112228 |
| 29 | 0.292272950216142 | 0.584545900432284 | 0.707727049783858 |
| 30 | 0.358117533759115 | 0.71623506751823 | 0.641882466240885 |
| 31 | 0.289248788541297 | 0.578497577082593 | 0.710751211458703 |
| 32 | 0.329237612418603 | 0.658475224837206 | 0.670762387581397 |
| 33 | 0.345479842837439 | 0.690959685674878 | 0.654520157162561 |
| 34 | 0.270494757236543 | 0.540989514473086 | 0.729505242763457 |
| 35 | 0.308658665894037 | 0.617317331788074 | 0.691341334105963 |
| 36 | 0.261548914855178 | 0.523097829710355 | 0.738451085144822 |
| 37 | 0.258965908763230 | 0.517931817526460 | 0.74103409123677 |
| 38 | 0.220651040761485 | 0.441302081522969 | 0.779348959238515 |
| 39 | 0.20302372828006 | 0.40604745656012 | 0.79697627171994 |
| 40 | 0.375004893836461 | 0.750009787672922 | 0.624995106163539 |
| 41 | 0.910267958866024 | 0.179464082267951 | 0.0897320411339757 |
| 42 | 0.839944931946726 | 0.320110136106548 | 0.160055068053274 |
| 43 | 0.720007027639395 | 0.559985944721211 | 0.279992972360605 |
| 44 | 0.636223141853016 | 0.727553716293968 | 0.363776858146984 |
| Meta Analysis of Goldfeld-Quandt test for Heteroskedasticity | |||
| Description | # significant tests | % significant tests | OK/NOK |
| 1% type I error level | 0 | 0 | OK |
| 5% type I error level | 0 | 0 | OK |
| 10% type I error level | 0 | 0 | OK |