| Multiple Linear Regression - Estimated Regression Equation |
| Y[t] = + 4746.19129722464 -866.780609791573X[t] + 0.156995128968414Y1[t] + 0.442321422199032Y2[t] + 0.0364744218977145Y3[t] -6690.66593526214M1[t] + 14375.1133278374M2[t] + 11689.2387306921M3[t] + 7477.25242961239M4[t] + 4810.45819860558M5[t] + 506.153729263371M6[t] + 3289.15893096822M7[t] -1351.27077153871M8[t] -2032.54263674398M9[t] + 2664.83981479995M10[t] + 5242.33673357328M11[t] + 14.8885796963493t + e[t] |
| Multiple Linear Regression - Ordinary Least Squares | |||||
| Variable | Parameter | S.D. | T-STAT H0: parameter = 0 | 2-tail p-value | 1-tail p-value |
| (Intercept) | 4746.19129722464 | 3544.00355 | 1.3392 | 0.187877 | 0.093939 |
| X | -866.780609791573 | 879.708747 | -0.9853 | 0.330254 | 0.165127 |
| Y1 | 0.156995128968414 | 0.157787 | 0.995 | 0.32558 | 0.16279 |
| Y2 | 0.442321422199032 | 0.141714 | 3.1212 | 0.003295 | 0.001648 |
| Y3 | 0.0364744218977145 | 0.155503 | 0.2346 | 0.815719 | 0.40786 |
| M1 | -6690.66593526214 | 1475.642246 | -4.5341 | 4.9e-05 | 2.5e-05 |
| M2 | 14375.1133278374 | 2320.460748 | 6.1949 | 0 | 0 |
| M3 | 11689.2387306921 | 2214.977542 | 5.2774 | 5e-06 | 2e-06 |
| M4 | 7477.25242961239 | 2474.349367 | 3.0219 | 0.004315 | 0.002157 |
| M5 | 4810.45819860558 | 2005.681778 | 2.3984 | 0.0211 | 0.01055 |
| M6 | 506.153729263371 | 1962.268029 | 0.2579 | 0.797741 | 0.398871 |
| M7 | 3289.15893096822 | 2169.03656 | 1.5164 | 0.137088 | 0.068544 |
| M8 | -1351.27077153871 | 1727.284386 | -0.7823 | 0.438528 | 0.219264 |
| M9 | -2032.54263674398 | 1812.282349 | -1.1215 | 0.268585 | 0.134292 |
| M10 | 2664.83981479995 | 1925.060804 | 1.3843 | 0.173759 | 0.086879 |
| M11 | 5242.33673357328 | 1345.082826 | 3.8974 | 0.000352 | 0.000176 |
| t | 14.8885796963493 | 23.781235 | 0.6261 | 0.534743 | 0.267371 |
| Multiple Linear Regression - Regression Statistics | |
| Multiple R | 0.96643382677579 |
| R-squared | 0.933994341536498 |
| Adjusted R-squared | 0.908236035794644 |
| F-TEST (value) | 36.2599291621446 |
| F-TEST (DF numerator) | 16 |
| F-TEST (DF denominator) | 41 |
| p-value | 0 |
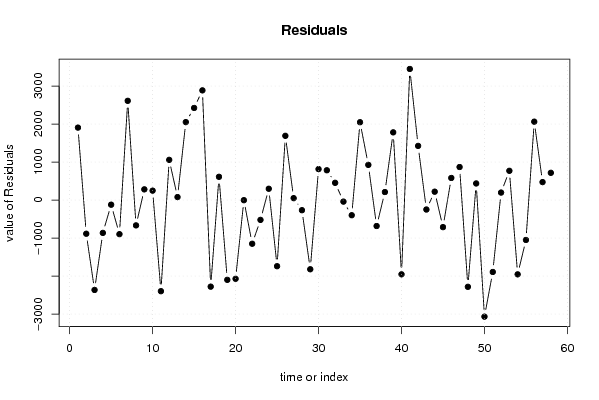
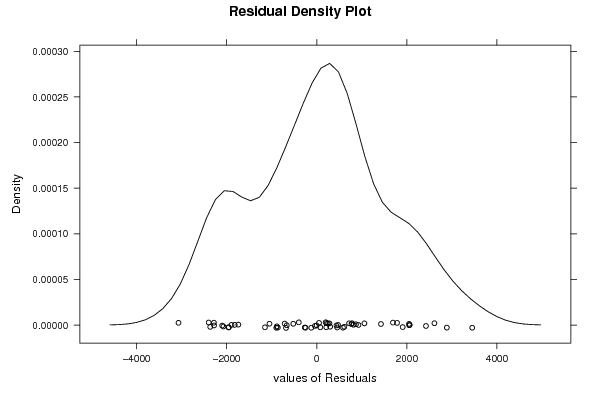
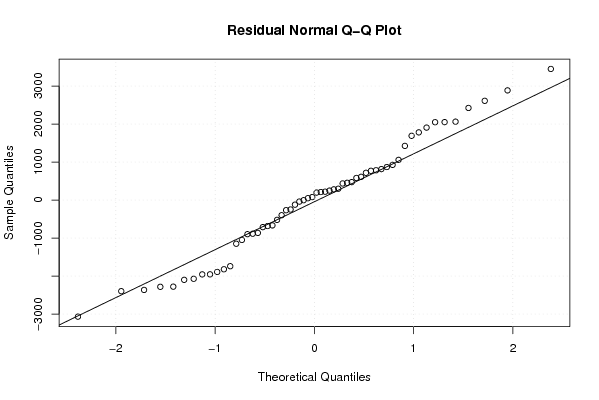
| Multiple Linear Regression - Residual Statistics | |
| Residual Standard Deviation | 1769.04422157133 |
| Sum Squared Residuals | 128310215.772871 |
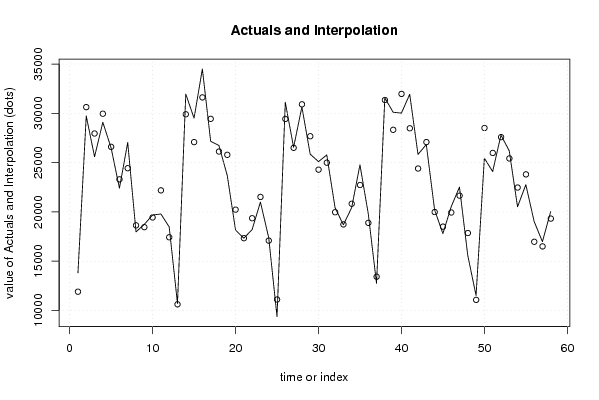
| Multiple Linear Regression - Actuals, Interpolation, and Residuals | |||
| Time or Index | Actuals | Interpolation Forecast | Residuals Prediction Error |
| 1 | 13807 | 11899.6582857616 | 1907.34171423840 |
| 2 | 29743 | 30628.5331519286 | -885.533151928608 |
| 3 | 25591 | 27955.9119575727 | -2364.91195757268 |
| 4 | 29096 | 29960.2287946607 | -864.228794660664 |
| 5 | 26482 | 26603.3289127761 | -121.328912776103 |
| 6 | 22405 | 23302.4225410951 | -897.422541095091 |
| 7 | 27044 | 24431.8618328153 | 2612.13816718472 |
| 8 | 17970 | 18635.9325361431 | -665.932536143107 |
| 9 | 18730 | 18448.1983098791 | 281.80169012088 |
| 10 | 19684 | 19435.3658972849 | 248.634102715128 |
| 11 | 19785 | 22182.7201253618 | -2397.72012536183 |
| 12 | 18479 | 17420.8236769308 | 1058.17632306917 |
| 13 | 10698 | 10619.4817450648 | 78.5182549351743 |
| 14 | 31956 | 29904.5826285772 | 2051.41737142279 |
| 15 | 29506 | 27081.6604816098 | 2424.33951839024 |
| 16 | 34506 | 31618.9860105747 | 2887.01398942533 |
| 17 | 27165 | 29443.7417804203 | -2278.74178042027 |
| 18 | 26736 | 26124.0694263630 | 611.93057363697 |
| 19 | 23691 | 25789.9028465623 | -2098.90284656226 |
| 20 | 18157 | 20228.7969347683 | -2071.79693476835 |
| 21 | 17328 | 17331.0863479581 | -3.08634795805432 |
| 22 | 18205 | 19354.3370521555 | -1149.33705215553 |
| 23 | 20995 | 21515.8733689456 | -520.873368945564 |
| 24 | 17382 | 17084.1202164058 | 297.879783594151 |
| 25 | 9367 | 11107.1842958168 | -1740.18429581677 |
| 26 | 31124 | 29433.1925186203 | 1690.80748137966 |
| 27 | 26551 | 26500.9612368955 | 50.038763104476 |
| 28 | 30651 | 30917.1694820137 | -266.169482013737 |
| 29 | 25859 | 27679.7819929862 | -1820.78199298618 |
| 30 | 25100 | 24284.7657450015 | 815.234254998543 |
| 31 | 25778 | 24993.4410981185 | 784.558901881504 |
| 32 | 20418 | 19963.8352835656 | 454.164716434412 |
| 33 | 18688 | 18728.1679448165 | -40.1679448165498 |
| 34 | 20424 | 20822.7242380013 | -398.724238001302 |
| 35 | 24776 | 22726.9343185841 | 2049.06568141592 |
| 36 | 19814 | 18887.4982050322 | 926.50179496784 |
| 37 | 12738 | 13421.0134453497 | -683.013445349716 |
| 38 | 31566 | 31354.7215427124 | 211.278457287635 |
| 39 | 30111 | 28328.7873485439 | 1782.21265145607 |
| 40 | 30019 | 31973.1964423267 | -1954.19644232665 |
| 41 | 31934 | 28483.2293755501 | 3450.77062444989 |
| 42 | 25826 | 24400.6953031753 | 1425.30469682473 |
| 43 | 26835 | 27083.3527135339 | -248.352713533948 |
| 44 | 20205 | 19984.3689469949 | 220.631053005066 |
| 45 | 17789 | 18500.624502473 | -711.624502473013 |
| 46 | 20520 | 19937.8069646408 | 582.193035359192 |
| 47 | 22518 | 21648.4721871085 | 869.527812891474 |
| 48 | 15572 | 17854.5579016312 | -2282.55790163116 |
| 49 | 11509 | 11071.6622280071 | 437.337771992913 |
| 50 | 25447 | 28514.9701581615 | -3067.97015816147 |
| 51 | 24090 | 25981.6789753781 | -1891.67897537811 |
| 52 | 27786 | 27588.4192704243 | 197.580729575718 |
| 53 | 26195 | 25424.9179382673 | 770.082061732657 |
| 54 | 20516 | 22471.0469843652 | -1955.04698436515 |
| 55 | 22759 | 23808.44150897 | -1049.44150897002 |
| 56 | 19028 | 16965.0662985280 | 2062.93370147198 |
| 57 | 16971 | 16497.9228948733 | 473.077105126737 |
| 58 | 20036 | 19318.7658479175 | 717.23415208251 |
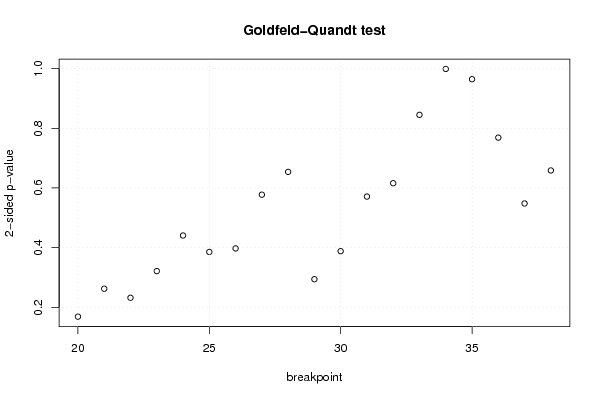
| Goldfeld-Quandt test for Heteroskedasticity | |||
| p-values | Alternative Hypothesis | ||
| breakpoint index | greater | 2-sided | less |
| 20 | 0.915576281154959 | 0.168847437690083 | 0.0844237188450413 |
| 21 | 0.868811896232415 | 0.262376207535169 | 0.131188103767585 |
| 22 | 0.883955485594838 | 0.232089028810324 | 0.116044514405162 |
| 23 | 0.839305196106945 | 0.321389607786111 | 0.160694803893055 |
| 24 | 0.779658720368048 | 0.440682559263904 | 0.220341279631952 |
| 25 | 0.807150769569582 | 0.385698460860835 | 0.192849230430418 |
| 26 | 0.801279744455446 | 0.397440511089109 | 0.198720255544554 |
| 27 | 0.711264860995648 | 0.577470278008705 | 0.288735139004352 |
| 28 | 0.673042009947973 | 0.653915980104053 | 0.326957990052027 |
| 29 | 0.852816115334931 | 0.294367769330138 | 0.147183884665069 |
| 30 | 0.805890788902268 | 0.388218422195463 | 0.194109211097732 |
| 31 | 0.714408606342331 | 0.571182787315337 | 0.285591393657669 |
| 32 | 0.692072141768938 | 0.615855716462124 | 0.307927858231062 |
| 33 | 0.57747841605572 | 0.845043167888559 | 0.422521583944279 |
| 34 | 0.500615407230609 | 0.998769185538782 | 0.499384592769391 |
| 35 | 0.482259852586103 | 0.964519705172206 | 0.517740147413897 |
| 36 | 0.384326924612248 | 0.768653849224496 | 0.615673075387752 |
| 37 | 0.274026711949665 | 0.548053423899330 | 0.725973288050335 |
| 38 | 0.329334520858637 | 0.658669041717275 | 0.670665479141363 |
| Meta Analysis of Goldfeld-Quandt test for Heteroskedasticity | |||
| Description | # significant tests | % significant tests | OK/NOK |
| 1% type I error level | 0 | 0 | OK |
| 5% type I error level | 0 | 0 | OK |
| 10% type I error level | 0 | 0 | OK |