| Multiple Linear Regression - Estimated Regression Equation |
| Y[t] = + 3086.07012968317 + 1029.87773295181X[t] + 0.349104238294711Y1[t] + 0.244365087497713Y2[t] + 0.335553698868969Y3[t] -0.331113011041976Y4[t] + 3112.6595004969M1[t] + 3772.75130059336M2[t] + 6074.5867318478M3[t] + 3017.52005227921M4[t] + 3327.18125048565M5[t] + 4366.06517737135M6[t] + 3452.46890980666M7[t] + 1033.45678168423M8[t] + 5183.76502098402M9[t] + 5750.95578491961M10[t] + 3520.34574469702M11[t] + 8.64931994290336t + e[t] |
| Multiple Linear Regression - Ordinary Least Squares | |||||
| Variable | Parameter | S.D. | T-STAT H0: parameter = 0 | 2-tail p-value | 1-tail p-value |
| (Intercept) | 3086.07012968317 | 2743.367215 | 1.1249 | 0.267678 | 0.133839 |
| X | 1029.87773295181 | 530.111595 | 1.9428 | 0.059482 | 0.029741 |
| Y1 | 0.349104238294711 | 0.154231 | 2.2635 | 0.029398 | 0.014699 |
| Y2 | 0.244365087497713 | 0.157967 | 1.5469 | 0.130167 | 0.065083 |
| Y3 | 0.335553698868969 | 0.149786 | 2.2402 | 0.031004 | 0.015502 |
| Y4 | -0.331113011041976 | 0.158431 | -2.0899 | 0.043368 | 0.021684 |
| M1 | 3112.6595004969 | 1032.343729 | 3.0151 | 0.00456 | 0.00228 |
| M2 | 3772.75130059336 | 1128.104194 | 3.3443 | 0.001864 | 0.000932 |
| M3 | 6074.5867318478 | 1043.812331 | 5.8196 | 1e-06 | 1e-06 |
| M4 | 3017.52005227921 | 915.16174 | 3.2973 | 0.002124 | 0.001062 |
| M5 | 3327.18125048565 | 860.224078 | 3.8678 | 0.000417 | 0.000209 |
| M6 | 4366.06517737135 | 832.942349 | 5.2417 | 6e-06 | 3e-06 |
| M7 | 3452.46890980666 | 1027.151733 | 3.3612 | 0.001779 | 0.00089 |
| M8 | 1033.45678168423 | 861.254795 | 1.1999 | 0.237589 | 0.118795 |
| M9 | 5183.76502098402 | 1064.699008 | 4.8688 | 2e-05 | 1e-05 |
| M10 | 5750.95578491961 | 1254.265328 | 4.5851 | 4.8e-05 | 2.4e-05 |
| M11 | 3520.34574469702 | 1065.262711 | 3.3047 | 0.002081 | 0.001041 |
| t | 8.64931994290336 | 11.298399 | 0.7655 | 0.448682 | 0.224341 |
| Multiple Linear Regression - Regression Statistics | |
| Multiple R | 0.900217706946649 |
| R-squared | 0.810391919900283 |
| Adjusted R-squared | 0.725567252487252 |
| F-TEST (value) | 9.55372941168509 |
| F-TEST (DF numerator) | 17 |
| F-TEST (DF denominator) | 38 |
| p-value | 5.256585167146e-09 |
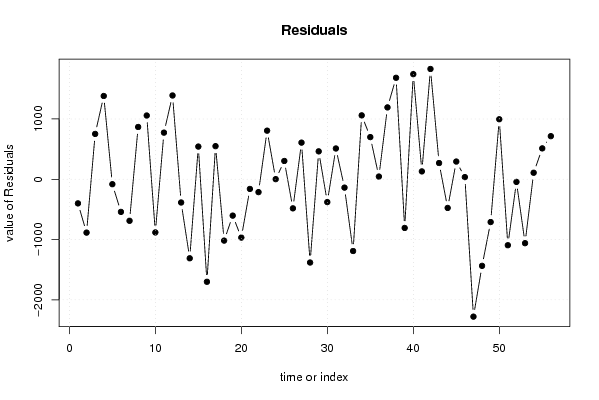
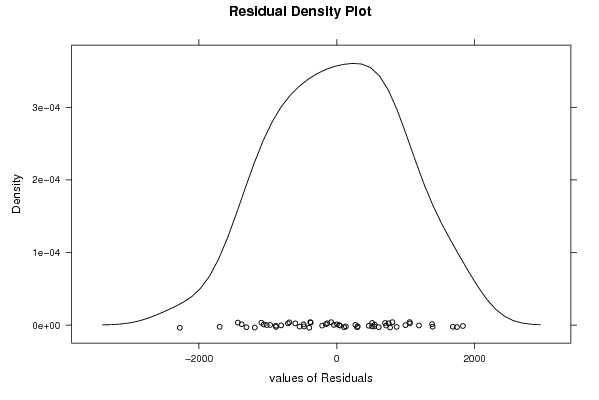
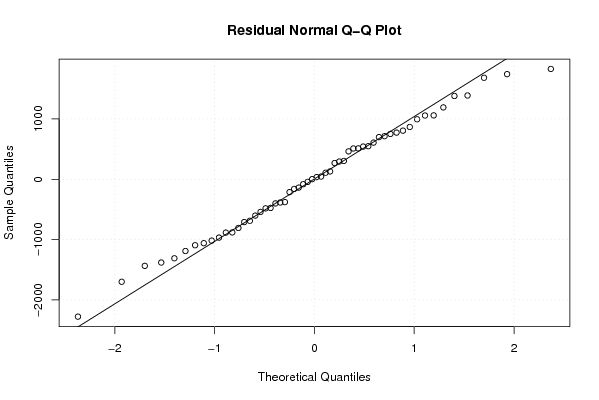
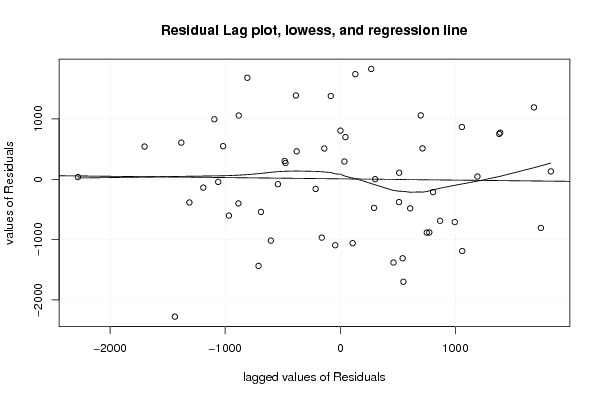
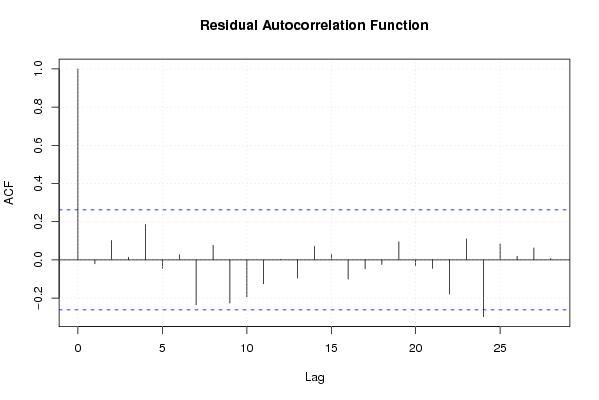
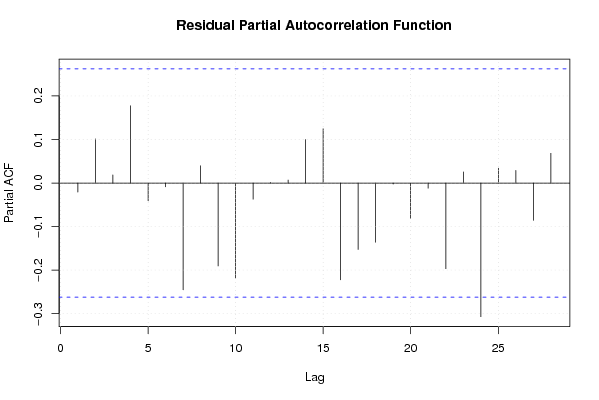
| Multiple Linear Regression - Residual Statistics | |
| Residual Standard Deviation | 1119.19048751641 |
| Sum Squared Residuals | 47598319.1991945 |
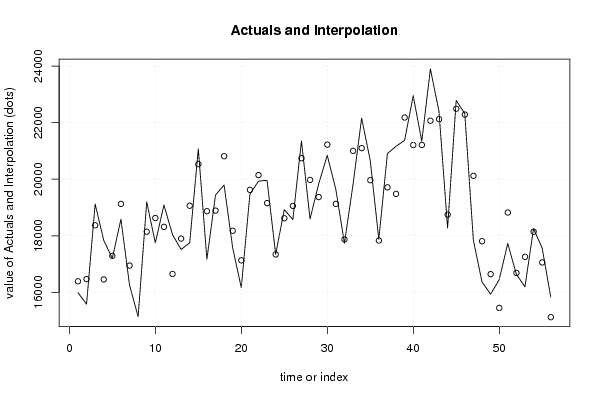
| Multiple Linear Regression - Actuals, Interpolation, and Residuals | |||
| Time or Index | Actuals | Interpolation Forecast | Residuals Prediction Error |
| 1 | 15991.2 | 16391.4156463212 | -400.215646321166 |
| 2 | 15583.6 | 16468.5158556123 | -884.9158556123 |
| 3 | 19123.5 | 18371.6987262737 | 751.801273726272 |
| 4 | 17838.7 | 16457.2322679961 | 1381.46773200386 |
| 5 | 17209.4 | 17291.4197458337 | -82.0197458337296 |
| 6 | 18586.5 | 19128.0896330134 | -541.58963301338 |
| 7 | 16258.1 | 16946.8888422906 | -688.788842290593 |
| 8 | 15141.6 | 14274.4369415472 | 867.163058452755 |
| 9 | 19202.1 | 18145.1003655654 | 1056.99963443461 |
| 10 | 17746.5 | 18628.3656288960 | -881.86562889595 |
| 11 | 19090.1 | 18316.6887802137 | 773.41121978631 |
| 12 | 18040.3 | 16650.5544597565 | 1389.74554024352 |
| 13 | 17515.5 | 17900.7862369868 | -385.286236986817 |
| 14 | 17751.8 | 19062.6010325871 | -1310.80103258706 |
| 15 | 21072.4 | 20530.188602666 | 542.211397333997 |
| 16 | 17170 | 18870.2541047229 | -1700.25410472288 |
| 17 | 19439.5 | 18890.7184001334 | 548.78159986659 |
| 18 | 19795.4 | 20812.9310062759 | -1017.53100627586 |
| 19 | 17574.9 | 18177.8582042070 | -602.958204206977 |
| 20 | 16165.4 | 17132.9535034078 | -967.553503407808 |
| 21 | 19464.6 | 19625.1985448531 | -160.598544853142 |
| 22 | 19932.1 | 20145.4306319171 | -213.330631917135 |
| 23 | 19961.2 | 19155.1589421756 | 806.041057824427 |
| 24 | 17343.4 | 17341.6246815332 | 1.77531846682331 |
| 25 | 18924.2 | 18620.6227592028 | 303.577240797171 |
| 26 | 18574.1 | 19056.4982130619 | -482.398213061923 |
| 27 | 21350.6 | 20743.0060392282 | 607.593960771834 |
| 28 | 18594.6 | 19975.5553075725 | -1380.95530757255 |
| 29 | 19832.1 | 19369.3134125899 | 462.786587410122 |
| 30 | 20844.4 | 21222.9804832400 | -378.580483239975 |
| 31 | 19640.2 | 19129.7122825814 | 510.487717418572 |
| 32 | 17735.4 | 17874.1240895034 | -138.724089503373 |
| 33 | 19813.6 | 21003.7721154782 | -1190.17211547817 |
| 34 | 22160 | 21100.3945434593 | 1059.60545654071 |
| 35 | 20664.3 | 19964.9751350432 | 699.324864956807 |
| 36 | 17877.4 | 17832.5535027985 | 44.8464972014501 |
| 37 | 20906.5 | 19714.6709996432 | 1191.82900035679 |
| 38 | 21164.1 | 19481.0514690465 | 1683.0485309535 |
| 39 | 21374.4 | 22181.7628858054 | -807.362885805437 |
| 40 | 22952.3 | 21208.9151537494 | 1743.38484625058 |
| 41 | 21343.5 | 21212.9314384861 | 130.568561513853 |
| 42 | 23899.3 | 22069.6816895366 | 1829.61831046341 |
| 43 | 22392.9 | 22123.6779166053 | 269.222083394673 |
| 44 | 18274.1 | 18749.6707636218 | -475.570763621771 |
| 45 | 22786.7 | 22492.9289741033 | 293.771025896705 |
| 46 | 22321.5 | 22285.9091957276 | 35.5908042723698 |
| 47 | 17842.2 | 20120.9771425675 | -2278.77714256754 |
| 48 | 16373.5 | 17809.8673559118 | -1436.36735591179 |
| 49 | 15933.8 | 16643.7043578460 | -709.904357845976 |
| 50 | 16446.1 | 15451.0334296922 | 995.066570307783 |
| 51 | 17729 | 18823.2437460267 | -1094.24374602666 |
| 52 | 16643 | 16686.643165959 | -43.6431659590128 |
| 53 | 16196.7 | 17256.8170029568 | -1060.11700295684 |
| 54 | 18252.1 | 18144.0171879342 | 108.082812065807 |
| 55 | 17570.4 | 17058.3627543157 | 512.037245684324 |
| 56 | 15836.8 | 15122.1147019198 | 714.685298080195 |
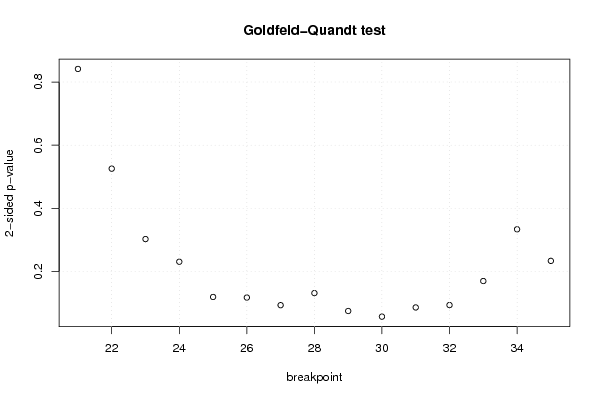
| Goldfeld-Quandt test for Heteroskedasticity | |||
| p-values | Alternative Hypothesis | ||
| breakpoint index | greater | 2-sided | less |
| 21 | 0.420664951862492 | 0.841329903724983 | 0.579335048137508 |
| 22 | 0.262872972420708 | 0.525745944841415 | 0.737127027579292 |
| 23 | 0.151471466131326 | 0.302942932262652 | 0.848528533868674 |
| 24 | 0.115600914293722 | 0.231201828587445 | 0.884399085706278 |
| 25 | 0.0598230685468692 | 0.119646137093738 | 0.940176931453131 |
| 26 | 0.0589303983150285 | 0.117860796630057 | 0.941069601684972 |
| 27 | 0.0468391483303059 | 0.0936782966606119 | 0.953160851669694 |
| 28 | 0.0659403331639868 | 0.131880666327974 | 0.934059666836013 |
| 29 | 0.0376295636488461 | 0.0752591272976922 | 0.962370436351154 |
| 30 | 0.0286847219264654 | 0.0573694438529307 | 0.971315278073535 |
| 31 | 0.0432394102091016 | 0.0864788204182033 | 0.956760589790898 |
| 32 | 0.047001246202308 | 0.094002492404616 | 0.952998753797692 |
| 33 | 0.0850206272734412 | 0.170041254546882 | 0.914979372726559 |
| 34 | 0.166914436203308 | 0.333828872406615 | 0.833085563796692 |
| 35 | 0.116950349147859 | 0.233900698295717 | 0.883049650852141 |
| Meta Analysis of Goldfeld-Quandt test for Heteroskedasticity | |||
| Description | # significant tests | % significant tests | OK/NOK |
| 1% type I error level | 0 | 0 | OK |
| 5% type I error level | 0 | 0 | OK |
| 10% type I error level | 5 | 0.333333333333333 | NOK |