| Multiple Linear Regression - Estimated Regression Equation |
| werkl[t] = + 9.50211597447777 + 0.0382783046099624`infl `[t] -0.305734809579039M1[t] -0.308084260797827M2[t] -0.274261542477623M3[t] -0.299673258065217M4[t] -0.248912804113808M5[t] -0.234324519701403M6[t] -0.215908404828002M7[t] -0.175961157770203M8[t] -0.157545042896801M9[t] -0.0821911923921968M10[t] -0.0599472470577996M11[t] -0.0368849826890027t + e[t] |
| Multiple Linear Regression - Ordinary Least Squares | |||||
| Variable | Parameter | S.D. | T-STAT H0: parameter = 0 | 2-tail p-value | 1-tail p-value |
| (Intercept) | 9.50211597447777 | 0.217124 | 43.7635 | 0 | 0 |
| `infl ` | 0.0382783046099624 | 0.081753 | 0.4682 | 0.641841 | 0.32092 |
| M1 | -0.305734809579039 | 0.213143 | -1.4344 | 0.158218 | 0.079109 |
| M2 | -0.308084260797827 | 0.212605 | -1.4491 | 0.154096 | 0.077048 |
| M3 | -0.274261542477623 | 0.212696 | -1.2895 | 0.203686 | 0.101843 |
| M4 | -0.299673258065217 | 0.212761 | -1.4085 | 0.165707 | 0.082854 |
| M5 | -0.248912804113808 | 0.214034 | -1.163 | 0.250845 | 0.125422 |
| M6 | -0.234324519701403 | 0.214397 | -1.0929 | 0.280108 | 0.140054 |
| M7 | -0.215908404828002 | 0.213464 | -1.0115 | 0.31709 | 0.158545 |
| M8 | -0.175961157770203 | 0.212269 | -0.829 | 0.411411 | 0.205705 |
| M9 | -0.157545042896801 | 0.211676 | -0.7443 | 0.460495 | 0.230248 |
| M10 | -0.0821911923921968 | 0.211768 | -0.3881 | 0.699718 | 0.349859 |
| M11 | -0.0599472470577996 | 0.210832 | -0.2843 | 0.777429 | 0.388714 |
| t | -0.0368849826890027 | 0.002947 | -12.5166 | 0 | 0 |
| Multiple Linear Regression - Regression Statistics | |
| Multiple R | 0.903710861624867 |
| R-squared | 0.81669332141876 |
| Adjusted R-squared | 0.764889260080584 |
| F-TEST (value) | 15.7650442903963 |
| F-TEST (DF numerator) | 13 |
| F-TEST (DF denominator) | 46 |
| p-value | 8.58646487245096e-13 |
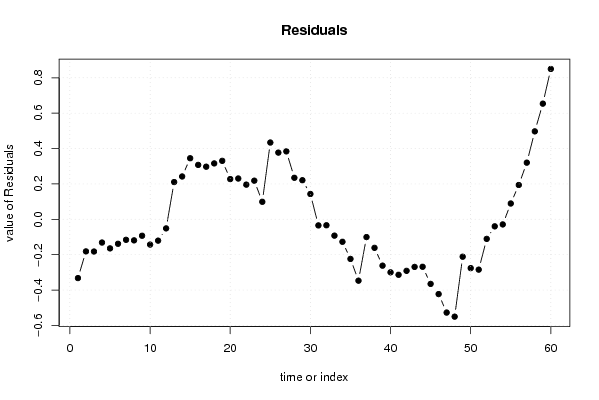
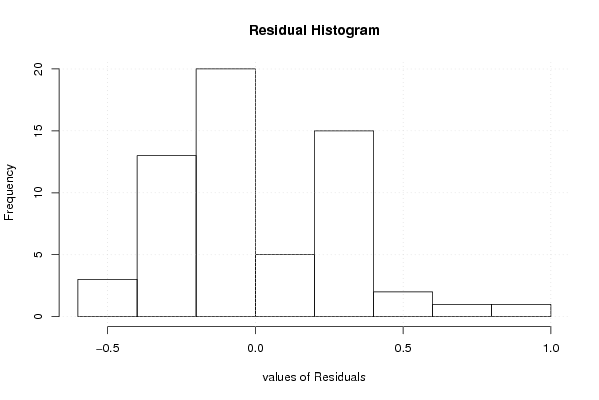
| Multiple Linear Regression - Residual Statistics | |
| Residual Standard Deviation | 0.333088119752957 |
| Sum Squared Residuals | 5.10359399394578 |
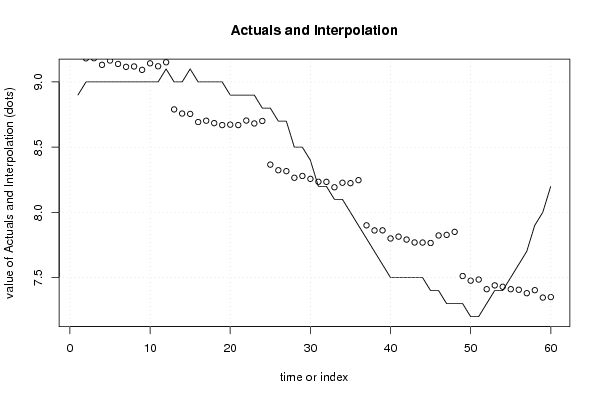
| Multiple Linear Regression - Actuals, Interpolation, and Residuals | |||
| Time or Index | Actuals | Interpolation Forecast | Residuals Prediction Error |
| 1 | 8.9 | 9.23222496096872 | -0.332224960968718 |
| 2 | 9 | 9.18150703567789 | -0.181507035677888 |
| 3 | 9 | 9.18227260177009 | -0.182272601770087 |
| 4 | 9 | 9.13145939487648 | -0.131459394876479 |
| 5 | 9 | 9.16447401844387 | -0.164474018443865 |
| 6 | 9 | 9.13834948970627 | -0.138349489706272 |
| 7 | 9 | 9.11605279142967 | -0.116052791429674 |
| 8 | 9 | 9.11911505579847 | -0.119115055798471 |
| 9 | 9 | 9.09299052706088 | -0.092990527060877 |
| 10 | 9 | 9.14294288625947 | -0.142942886259467 |
| 11 | 9 | 9.12064618798287 | -0.120646187982870 |
| 12 | 9.1 | 9.15136411327366 | -0.0513641132736598 |
| 13 | 9 | 8.78960516870064 | 0.210394831299365 |
| 14 | 9 | 8.75802639571484 | 0.241973604285163 |
| 15 | 9.1 | 8.75496413134604 | 0.34503586865396 |
| 16 | 9 | 8.69266743306944 | 0.307332566930558 |
| 17 | 9 | 8.70271507387085 | 0.297284926129148 |
| 18 | 9 | 8.68424620605525 | 0.315753793944749 |
| 19 | 9 | 8.66960516870065 | 0.330394831299355 |
| 20 | 8.9 | 8.67266743306944 | 0.227332566930558 |
| 21 | 8.9 | 8.66950988709783 | 0.230490112902174 |
| 22 | 8.9 | 8.70415092445243 | 0.195849075547569 |
| 23 | 8.9 | 8.68185422617583 | 0.218145773824167 |
| 24 | 8.8 | 8.70108866008363 | 0.0989113399163669 |
| 25 | 8.8 | 8.36612452873758 | 0.433875471262416 |
| 26 | 8.7 | 8.3230622643688 | 0.376937735631202 |
| 27 | 8.7 | 8.316172169539 | 0.383827830460996 |
| 28 | 8.5 | 8.2653589626454 | 0.234641037354605 |
| 29 | 8.5 | 8.2792344339078 | 0.220765566092199 |
| 30 | 8.4 | 8.2569377356312 | 0.143062264368797 |
| 31 | 8.2 | 8.2346410373546 | -0.0346410373546059 |
| 32 | 8.2 | 8.2338754712624 | -0.0338754712624065 |
| 33 | 8.1 | 8.19243962068083 | -0.092439620680827 |
| 34 | 8.1 | 8.22708065803543 | -0.127080658035433 |
| 35 | 8 | 8.22392311206382 | -0.223923112063816 |
| 36 | 7.9 | 8.24698537643261 | -0.346985376432612 |
| 37 | 7.8 | 7.90053775370357 | -0.100537753703574 |
| 38 | 7.7 | 7.86130331979578 | -0.161303319795783 |
| 39 | 7.6 | 7.86206888588798 | -0.262068885887982 |
| 40 | 7.5 | 7.79977218761139 | -0.299772187611385 |
| 41 | 7.5 | 7.81364765887379 | -0.313647658873791 |
| 42 | 7.5 | 7.79135096059719 | -0.291350960597193 |
| 43 | 7.5 | 7.7690542623206 | -0.269054262320595 |
| 44 | 7.5 | 7.7682886962284 | -0.268288696228396 |
| 45 | 7.4 | 7.76513115025678 | -0.365131150256779 |
| 46 | 7.4 | 7.82273917037736 | -0.422739170377362 |
| 47 | 7.3 | 7.82723728532774 | -0.527237285327739 |
| 48 | 7.3 | 7.85029954969654 | -0.550299549696535 |
| 49 | 7.3 | 7.51150758788949 | -0.211507587889489 |
| 50 | 7.2 | 7.4761009844427 | -0.276100984442694 |
| 51 | 7.2 | 7.48452221145689 | -0.284522211456886 |
| 52 | 7.3 | 7.4107420217973 | -0.110742021797300 |
| 53 | 7.4 | 7.43992881490369 | -0.0399288149036907 |
| 54 | 7.4 | 7.42911560801008 | -0.0291156080100815 |
| 55 | 7.5 | 7.41064674019448 | 0.08935325980552 |
| 56 | 7.6 | 7.40605334364128 | 0.193946656358715 |
| 57 | 7.7 | 7.37992881490369 | 0.320071185096309 |
| 58 | 7.9 | 7.4030863608753 | 0.496913639124693 |
| 59 | 8 | 7.34633918844974 | 0.653660811550257 |
| 60 | 8.2 | 7.35026230051356 | 0.84973769948644 |
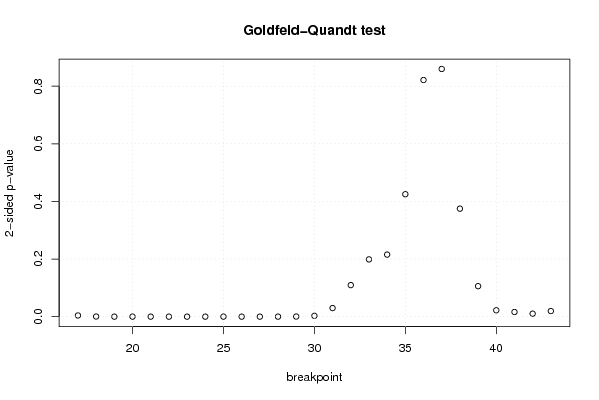
| Goldfeld-Quandt test for Heteroskedasticity | |||
| p-values | Alternative Hypothesis | ||
| breakpoint index | greater | 2-sided | less |
| 17 | 0.00209231704246703 | 0.00418463408493406 | 0.997907682957533 |
| 18 | 0.000212792498804379 | 0.000425584997608758 | 0.999787207501196 |
| 19 | 2.109948659405e-05 | 4.21989731881e-05 | 0.999978900513406 |
| 20 | 1.40731864865647e-05 | 2.81463729731295e-05 | 0.999985926813513 |
| 21 | 6.94130624600258e-06 | 1.38826124920052e-05 | 0.999993058693754 |
| 22 | 1.85863720755150e-06 | 3.71727441510301e-06 | 0.999998141362793 |
| 23 | 4.40402031589288e-07 | 8.80804063178576e-07 | 0.999999559597968 |
| 24 | 2.69810284734183e-06 | 5.39620569468367e-06 | 0.999997301897153 |
| 25 | 1.09282810463414e-06 | 2.18565620926828e-06 | 0.999998907171895 |
| 26 | 2.13525277768341e-06 | 4.27050555536683e-06 | 0.999997864747222 |
| 27 | 5.83896801659248e-06 | 1.16779360331850e-05 | 0.999994161031983 |
| 28 | 4.28452850313248e-05 | 8.56905700626496e-05 | 0.999957154714969 |
| 29 | 0.000197440982472853 | 0.000394881964945705 | 0.999802559017527 |
| 30 | 0.00144446252000075 | 0.00288892504000149 | 0.99855553748 |
| 31 | 0.0148944659755933 | 0.0297889319511866 | 0.985105534024407 |
| 32 | 0.0547376250402027 | 0.109475250080405 | 0.945262374959797 |
| 33 | 0.0993976203080134 | 0.198795240616027 | 0.900602379691987 |
| 34 | 0.107702853892166 | 0.215405707784331 | 0.892297146107834 |
| 35 | 0.212476814846421 | 0.424953629692841 | 0.78752318515358 |
| 36 | 0.410650845314699 | 0.821301690629397 | 0.589349154685301 |
| 37 | 0.570119353658562 | 0.859761292682876 | 0.429880646341438 |
| 38 | 0.812599827891828 | 0.374800344216343 | 0.187400172108172 |
| 39 | 0.947094725629795 | 0.105810548740411 | 0.0529052743702053 |
| 40 | 0.988941058091569 | 0.0221178838168623 | 0.0110589419084311 |
| 41 | 0.991935931663711 | 0.0161281366725780 | 0.00806406833628901 |
| 42 | 0.994829847962508 | 0.0103403040749835 | 0.00517015203749175 |
| 43 | 0.99026033923048 | 0.0194793215390387 | 0.00973966076951937 |
| Meta Analysis of Goldfeld-Quandt test for Heteroskedasticity | |||
| Description | # significant tests | % significant tests | OK/NOK |
| 1% type I error level | 14 | 0.518518518518518 | NOK |
| 5% type I error level | 19 | 0.703703703703704 | NOK |
| 10% type I error level | 19 | 0.703703703703704 | NOK |