| Multiple Linear Regression - Estimated Regression Equation |
| Y[t] = + 62.0612446771867 + 11.2313886269777X[t] + 0.903839553931842Y1[t] + 0.138496282550783Y2[t] -0.0268436559582434Y3[t] -0.106380515370436Y4[t] -0.304423604736795M1[t] -8.57352205803797M2[t] -15.1525310336085M3[t] -10.9992974103655M4[t] -16.0366466935367M5[t] -3.40079273180213M6[t] + 46.5949436809979M7[t] + 7.48450705642377M8[t] -22.312510614135M9[t] -29.1933619104057M10[t] -19.6969423104956M11[t] -0.303391881932367t + e[t] |
| Multiple Linear Regression - Ordinary Least Squares | |||||
| Variable | Parameter | S.D. | T-STAT H0: parameter = 0 | 2-tail p-value | 1-tail p-value |
| (Intercept) | 62.0612446771867 | 29.090164 | 2.1334 | 0.039238 | 0.019619 |
| X | 11.2313886269777 | 4.118796 | 2.7269 | 0.009532 | 0.004766 |
| Y1 | 0.903839553931842 | 0.153865 | 5.8742 | 1e-06 | 0 |
| Y2 | 0.138496282550783 | 0.211339 | 0.6553 | 0.516105 | 0.258052 |
| Y3 | -0.0268436559582434 | 0.204305 | -0.1314 | 0.896142 | 0.448071 |
| Y4 | -0.106380515370436 | 0.15215 | -0.6992 | 0.488588 | 0.244294 |
| M1 | -0.304423604736795 | 5.151245 | -0.0591 | 0.953177 | 0.476588 |
| M2 | -8.57352205803797 | 6.08372 | -1.4093 | 0.166684 | 0.083342 |
| M3 | -15.1525310336085 | 6.209176 | -2.4403 | 0.019319 | 0.009659 |
| M4 | -10.9992974103655 | 5.5677 | -1.9756 | 0.055312 | 0.027656 |
| M5 | -16.0366466935367 | 5.11864 | -3.133 | 0.003278 | 0.001639 |
| M6 | -3.40079273180213 | 5.061933 | -0.6718 | 0.505648 | 0.252824 |
| M7 | 46.5949436809979 | 5.51456 | 8.4494 | 0 | 0 |
| M8 | 7.48450705642377 | 11.60072 | 0.6452 | 0.522591 | 0.261295 |
| M9 | -22.312510614135 | 12.101186 | -1.8438 | 0.072816 | 0.036408 |
| M10 | -29.1933619104057 | 11.412181 | -2.5581 | 0.014524 | 0.007262 |
| M11 | -19.6969423104956 | 5.519844 | -3.5684 | 0.000971 | 0.000485 |
| t | -0.303391881932367 | 0.132367 | -2.2921 | 0.027384 | 0.013692 |
| Multiple Linear Regression - Regression Statistics | |
| Multiple R | 0.9916496435823 |
| R-squared | 0.983369015616902 |
| Adjusted R-squared | 0.97611961216786 |
| F-TEST (value) | 135.648267133865 |
| F-TEST (DF numerator) | 17 |
| F-TEST (DF denominator) | 39 |
| p-value | 0 |
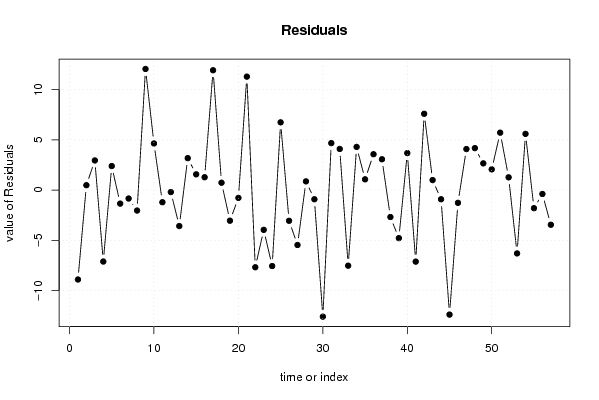
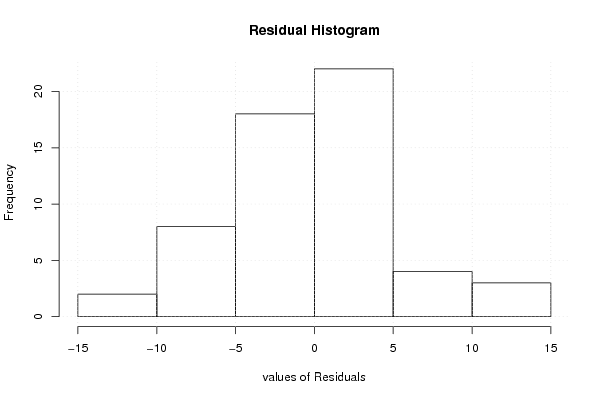
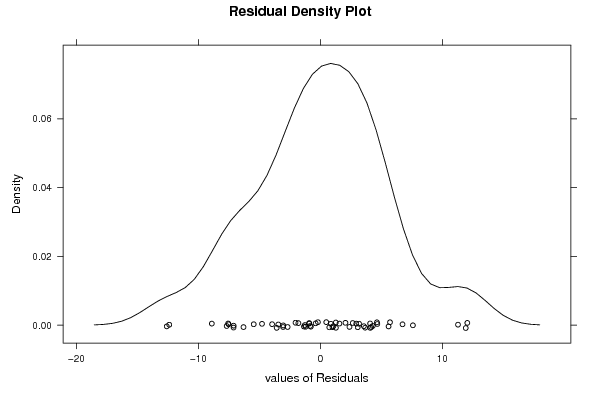
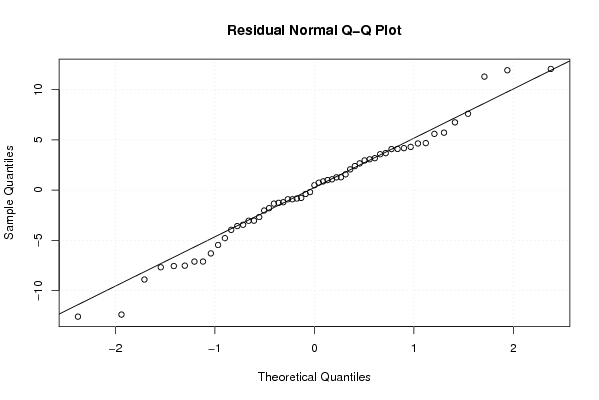
| Multiple Linear Regression - Residual Statistics | |
| Residual Standard Deviation | 6.43186455317889 |
| Sum Squared Residuals | 1613.38638358712 |
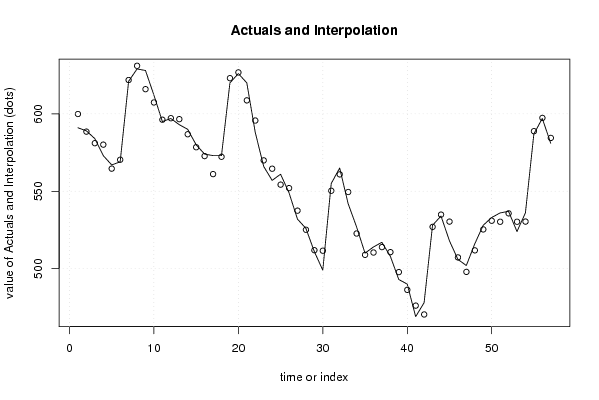
| Multiple Linear Regression - Actuals, Interpolation, and Residuals | |||
| Time or Index | Actuals | Interpolation Forecast | Residuals Prediction Error |
| 1 | 591 | 599.892025902565 | -8.89202590256489 |
| 2 | 589 | 588.511776816186 | 0.488223183814306 |
| 3 | 584 | 581.049336825955 | 2.95066317404505 |
| 4 | 573 | 580.103982340967 | -7.10398234096754 |
| 5 | 567 | 564.607734043258 | 2.39226595674198 |
| 6 | 569 | 570.340679001943 | -1.34067900194263 |
| 7 | 621 | 621.836907737762 | -0.836907737762074 |
| 8 | 629 | 631.030976205637 | -2.03097620563719 |
| 9 | 628 | 615.947685557548 | 12.0523144424523 |
| 10 | 612 | 607.35894194525 | 4.64105805475053 |
| 11 | 595 | 596.205504470838 | -1.20550447083832 |
| 12 | 597 | 597.193641494743 | -0.193641494742516 |
| 13 | 593 | 596.574947323276 | -3.57494732327611 |
| 14 | 590 | 586.822521734634 | 3.17747826536618 |
| 15 | 580 | 578.429398534513 | 1.57060146548678 |
| 16 | 574 | 572.719969481945 | 1.28003051805481 |
| 17 | 573 | 561.077281197099 | 11.9227188029008 |
| 18 | 573 | 572.262504133359 | 0.737495866641411 |
| 19 | 620 | 623.041219471129 | -3.04121947112932 |
| 20 | 626 | 626.7729767476 | -0.772976747600198 |
| 21 | 620 | 608.711310313957 | 11.2886896860426 |
| 22 | 588 | 595.67335567743 | -7.67335567743049 |
| 23 | 566 | 569.951593816125 | -3.95159381612462 |
| 24 | 557 | 564.551571860089 | -7.55157186008916 |
| 25 | 561 | 554.259562254803 | 6.74043774519735 |
| 26 | 549 | 552.050700515275 | -3.05070051527468 |
| 27 | 532 | 537.458174382567 | -5.45817438256663 |
| 28 | 526 | 525.130838330928 | 0.869161669072479 |
| 29 | 511 | 511.909224848887 | -0.90922484888677 |
| 30 | 499 | 511.586024260142 | -12.5860242601420 |
| 31 | 555 | 550.324380602613 | 4.67561939738731 |
| 32 | 565 | 560.904549657276 | 4.09545034272385 |
| 33 | 542 | 549.516159069003 | -7.51615906900278 |
| 34 | 527 | 522.701890426659 | 4.29810957334124 |
| 35 | 510 | 508.926164916664 | 1.07383508333602 |
| 36 | 514 | 510.430597623459 | 3.56940237654056 |
| 37 | 517 | 513.933110242048 | 3.06688975795195 |
| 38 | 508 | 510.67817358066 | -2.67817358065981 |
| 39 | 493 | 497.777799722887 | -4.77779972288714 |
| 40 | 490 | 486.317528582907 | 3.68247141709336 |
| 41 | 469 | 476.110275875259 | -7.11027587525868 |
| 42 | 478 | 470.406697952547 | 7.59330204745259 |
| 43 | 528 | 527.001415233666 | 0.998584766333523 |
| 44 | 534 | 534.908889287943 | -0.908889287943508 |
| 45 | 518 | 530.380117732715 | -12.3801177327152 |
| 46 | 506 | 507.265811950661 | -1.26581195066128 |
| 47 | 502 | 497.916736796373 | 4.08326320362692 |
| 48 | 516 | 511.824189021709 | 4.17581097829111 |
| 49 | 528 | 525.340354277308 | 2.65964572269169 |
| 50 | 533 | 530.936827353246 | 2.063172646754 |
| 51 | 536 | 530.285290534078 | 5.71470946592194 |
| 52 | 537 | 535.727681263253 | 1.27231873674689 |
| 53 | 524 | 530.295484035497 | -6.29548403549729 |
| 54 | 536 | 530.404094652009 | 5.59590534799061 |
| 55 | 587 | 588.79607695483 | -1.79607695482944 |
| 56 | 597 | 597.382608101543 | -0.382608101542956 |
| 57 | 581 | 584.444727326777 | -3.44472732677695 |
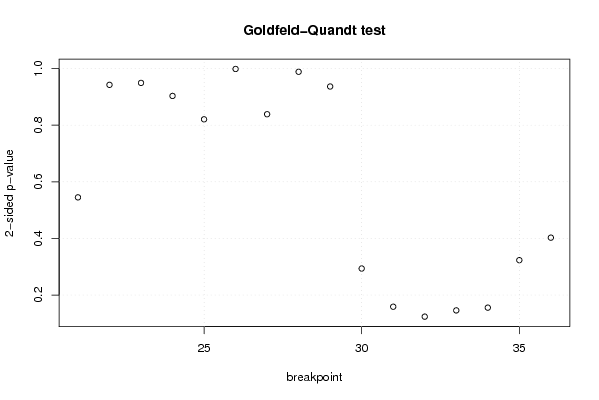
| Goldfeld-Quandt test for Heteroskedasticity | |||
| p-values | Alternative Hypothesis | ||
| breakpoint index | greater | 2-sided | less |
| 21 | 0.272549431615457 | 0.545098863230914 | 0.727450568384543 |
| 22 | 0.47118099796707 | 0.94236199593414 | 0.52881900203293 |
| 23 | 0.474596607027094 | 0.949193214054188 | 0.525403392972906 |
| 24 | 0.451610518421278 | 0.903221036842556 | 0.548389481578722 |
| 25 | 0.589689035290553 | 0.820621929418893 | 0.410310964709447 |
| 26 | 0.4992397087981 | 0.9984794175962 | 0.5007602912019 |
| 27 | 0.419293161793191 | 0.838586323586381 | 0.580706838206809 |
| 28 | 0.505753311920815 | 0.98849337615837 | 0.494246688079185 |
| 29 | 0.531771030390687 | 0.936457939218626 | 0.468228969609313 |
| 30 | 0.853104444809417 | 0.293791110381167 | 0.146895555190583 |
| 31 | 0.920560825771262 | 0.158878348457476 | 0.079439174228738 |
| 32 | 0.93808088628992 | 0.12383822742016 | 0.06191911371008 |
| 33 | 0.927051512777979 | 0.145896974444042 | 0.0729484872220211 |
| 34 | 0.92219085366422 | 0.155618292671559 | 0.0778091463357793 |
| 35 | 0.838345540782173 | 0.323308918435654 | 0.161654459217827 |
| 36 | 0.798623783445574 | 0.402752433108853 | 0.201376216554426 |
| Meta Analysis of Goldfeld-Quandt test for Heteroskedasticity | |||
| Description | # significant tests | % significant tests | OK/NOK |
| 1% type I error level | 0 | 0 | OK |
| 5% type I error level | 0 | 0 | OK |
| 10% type I error level | 0 | 0 | OK |