| Multiple Linear Regression - Estimated Regression Equation |
| Inflatie[t] = + 0.543937208204278 + 1.03190587642702`yt-1`[t] + 0.00311594207492439`yt-2`[t] + 0.0625948070164088`yt-3`[t] -0.223419091554451`yt-4`[t] + 0.55477286988978Kredietcrisis[t] + 0.138013235580985M1[t] -0.0633444684359386M2[t] + 0.0412969737820374M3[t] + 0.0160581190123575M4[t] + 0.118222226316890M5[t] -0.0266887211638146M6[t] + 0.120851047017496M7[t] -0.0360998595273063M8[t] -0.136471275857123M9[t] -0.00225950808331554M10[t] + 0.193711021693291M11[t] -0.0192085947006778t + e[t] |
| Multiple Linear Regression - Ordinary Least Squares | |||||
| Variable | Parameter | S.D. | T-STAT H0: parameter = 0 | 2-tail p-value | 1-tail p-value |
| (Intercept) | 0.543937208204278 | 0.38108 | 1.4274 | 0.161644 | 0.080822 |
| `yt-1` | 1.03190587642702 | 0.160828 | 6.4162 | 0 | 0 |
| `yt-2` | 0.00311594207492439 | 0.242829 | 0.0128 | 0.989829 | 0.494915 |
| `yt-3` | 0.0625948070164088 | 0.256666 | 0.2439 | 0.808638 | 0.404319 |
| `yt-4` | -0.223419091554451 | 0.17637 | -1.2668 | 0.21295 | 0.106475 |
| Kredietcrisis | 0.55477286988978 | 0.334214 | 1.6599 | 0.105159 | 0.052579 |
| M1 | 0.138013235580985 | 0.368967 | 0.3741 | 0.710444 | 0.355222 |
| M2 | -0.0633444684359386 | 0.368265 | -0.172 | 0.864344 | 0.432172 |
| M3 | 0.0412969737820374 | 0.370395 | 0.1115 | 0.911811 | 0.455906 |
| M4 | 0.0160581190123575 | 0.371267 | 0.0433 | 0.965727 | 0.482863 |
| M5 | 0.118222226316890 | 0.368993 | 0.3204 | 0.750427 | 0.375213 |
| M6 | -0.0266887211638146 | 0.370597 | -0.072 | 0.942967 | 0.471484 |
| M7 | 0.120851047017496 | 0.373598 | 0.3235 | 0.748106 | 0.374053 |
| M8 | -0.0360998595273063 | 0.371068 | -0.0973 | 0.92301 | 0.461505 |
| M9 | -0.136471275857123 | 0.388445 | -0.3513 | 0.727283 | 0.363642 |
| M10 | -0.00225950808331554 | 0.390185 | -0.0058 | 0.99541 | 0.497705 |
| M11 | 0.193711021693291 | 0.38966 | 0.4971 | 0.621963 | 0.310981 |
| t | -0.0192085947006778 | 0.010719 | -1.792 | 0.081101 | 0.040551 |
| Multiple Linear Regression - Regression Statistics | |
| Multiple R | 0.95872572457677 |
| R-squared | 0.919155014965253 |
| Adjusted R-squared | 0.882987521660234 |
| F-TEST (value) | 25.4138435089642 |
| F-TEST (DF numerator) | 17 |
| F-TEST (DF denominator) | 38 |
| p-value | 1.11022302462516e-15 |
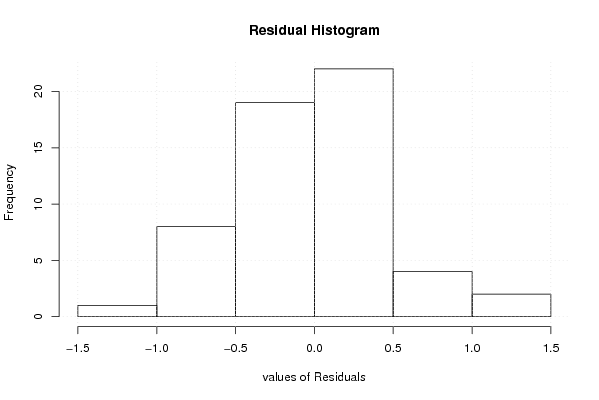
| Multiple Linear Regression - Residual Statistics | |
| Residual Standard Deviation | 0.545063925154349 |
| Sum Squared Residuals | 11.2895979351773 |
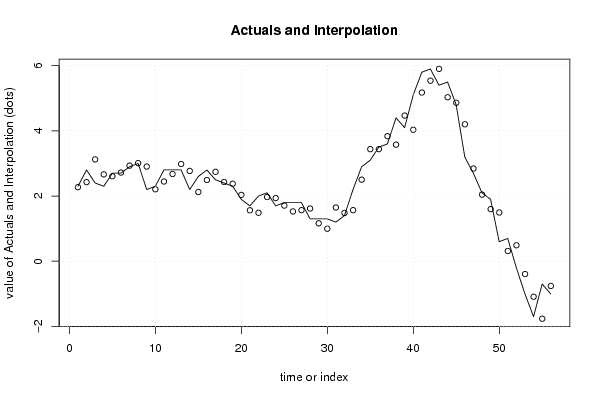
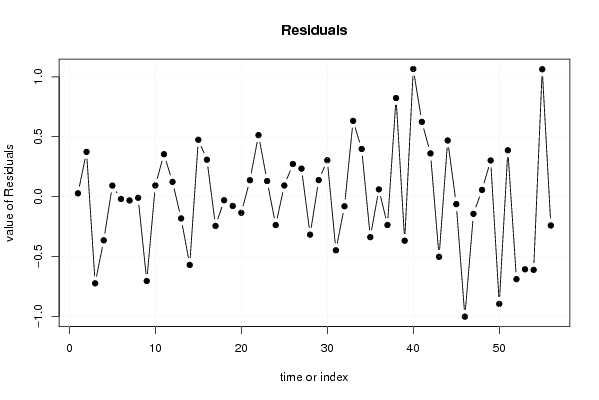
| Multiple Linear Regression - Actuals, Interpolation, and Residuals | |||
| Time or Index | Actuals | Interpolation Forecast | Residuals Prediction Error |
| 1 | 2.3 | 2.27321040082170 | 0.0267895991782954 |
| 2 | 2.8 | 2.42685717305492 | 0.373142826945083 |
| 3 | 2.4 | 3.12480485873162 | -0.724804858731624 |
| 4 | 2.3 | 2.6655895626774 | -0.365589562677398 |
| 5 | 2.7 | 2.60837978685045 | 0.09162021314955 |
| 6 | 2.7 | 2.71996353244859 | -0.0199635324485925 |
| 7 | 2.9 | 2.93264923867934 | -0.0326492386793361 |
| 8 | 3 | 3.01025074468127 | -0.0102507446812690 |
| 9 | 2.2 | 2.90511687308668 | -0.705116873086679 |
| 10 | 2.3 | 2.20742590062897 | 0.0925740993710305 |
| 11 | 2.8 | 2.44646133207841 | 0.353538667921589 |
| 12 | 2.8 | 2.67738849333687 | 0.122611506663128 |
| 13 | 2.8 | 2.98274585919984 | -0.182745859199843 |
| 14 | 2.2 | 2.771135054835 | -0.571135054835001 |
| 15 | 2.6 | 2.12571483071886 | 0.474285169281138 |
| 16 | 2.8 | 2.49216016657436 | 0.307839833425642 |
| 17 | 2.5 | 2.74518634708374 | -0.245186347083740 |
| 18 | 2.4 | 2.43120760812847 | -0.0312076081284717 |
| 19 | 2.3 | 2.37856473612543 | -0.0785647361254265 |
| 20 | 1.9 | 2.03544079261394 | -0.135440792613939 |
| 21 | 1.7 | 1.56355308356984 | 0.136446916430161 |
| 22 | 2 | 1.4870111329814 | 0.5129888670186 |
| 23 | 2.1 | 1.97002562891933 | 0.129974371080669 |
| 24 | 1.7 | 1.93808005800904 | -0.23808005800904 |
| 25 | 1.8 | 1.70789620294184 | 0.0921037970581553 |
| 26 | 1.8 | 1.52850786827228 | 0.271492131727719 |
| 27 | 1.8 | 1.56687247803506 | 0.233127521964937 |
| 28 | 1.3 | 1.61805214588813 | -0.318052145888126 |
| 29 | 1.3 | 1.16271281112303 | 0.137287188876974 |
| 30 | 1.3 | 0.997035297904183 | 0.302964702095818 |
| 31 | 1.2 | 1.64884193776639 | -0.448841937766391 |
| 32 | 1.4 | 1.48120139465543 | -0.0812013946554349 |
| 33 | 2.2 | 1.56769096470285 | 0.632309035297149 |
| 34 | 2.9 | 2.50258254663094 | 0.397417453369059 |
| 35 | 3.1 | 3.43903221942445 | -0.339032219424449 |
| 36 | 3.5 | 3.44006696507057 | 0.0599330349294315 |
| 37 | 3.6 | 3.83733823660459 | -0.237338236604593 |
| 38 | 4.4 | 3.57733449967483 | 0.82266550032517 |
| 39 | 4.1 | 4.46895774703691 | -0.36895774703691 |
| 40 | 5.1 | 4.03432313237825 | 1.06567686762175 |
| 41 | 5.8 | 5.17598367524432 | 0.624016324755676 |
| 42 | 5.9 | 5.5398004732883 | 0.360199526711704 |
| 43 | 5.4 | 5.90312392834682 | -0.503123928346822 |
| 44 | 5.5 | 5.03172035645236 | 0.468279643547639 |
| 45 | 4.8 | 4.86363907864063 | -0.0636390786406308 |
| 46 | 3.2 | 4.20298041975869 | -1.00298041975869 |
| 47 | 2.7 | 2.84448081957781 | -0.144480819577808 |
| 48 | 2.1 | 2.04446448358352 | 0.0555355164164808 |
| 49 | 1.9 | 1.59880930043201 | 0.301190699567986 |
| 50 | 0.6 | 1.49616540416297 | -0.896165404162971 |
| 51 | 0.7 | 0.313650085477540 | 0.386349914522460 |
| 52 | -0.2 | 0.489874992481871 | -0.689874992481871 |
| 53 | -1 | -0.392262620301541 | -0.607737379698459 |
| 54 | -1.7 | -1.08800691176954 | -0.611993088230457 |
| 55 | -0.7 | -1.76317984091798 | 1.06317984091798 |
| 56 | -1 | -0.758613288403004 | -0.241386711596996 |
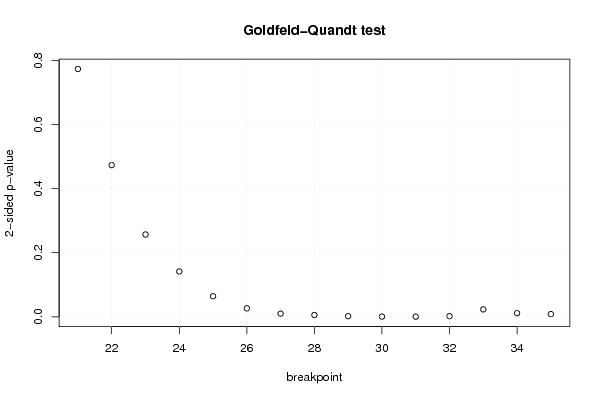
| Goldfeld-Quandt test for Heteroskedasticity | |||
| p-values | Alternative Hypothesis | ||
| breakpoint index | greater | 2-sided | less |
| 21 | 0.386476754207049 | 0.772953508414097 | 0.613523245792951 |
| 22 | 0.236467953194860 | 0.472935906389721 | 0.76353204680514 |
| 23 | 0.128308737649625 | 0.25661747529925 | 0.871691262350375 |
| 24 | 0.0707207791659167 | 0.141441558331833 | 0.929279220834083 |
| 25 | 0.0320473324343146 | 0.0640946648686291 | 0.967952667565685 |
| 26 | 0.0132101221697683 | 0.0264202443395366 | 0.986789877830232 |
| 27 | 0.00493330502319232 | 0.00986661004638463 | 0.995066694976808 |
| 28 | 0.00275314053678324 | 0.00550628107356649 | 0.997246859463217 |
| 29 | 0.000950251194011456 | 0.00190050238802291 | 0.999049748805989 |
| 30 | 0.000283634394580252 | 0.000567268789160503 | 0.99971636560542 |
| 31 | 0.000198447690583984 | 0.000396895381167968 | 0.999801552309416 |
| 32 | 0.000944130285586264 | 0.00188826057117253 | 0.999055869714414 |
| 33 | 0.0115541614491485 | 0.0231083228982970 | 0.988445838550851 |
| 34 | 0.00570277473159127 | 0.0114055494631825 | 0.994297225268409 |
| 35 | 0.00424616509520294 | 0.00849233019040588 | 0.995753834904797 |
| Meta Analysis of Goldfeld-Quandt test for Heteroskedasticity | |||
| Description | # significant tests | % significant tests | OK/NOK |
| 1% type I error level | 7 | 0.466666666666667 | NOK |
| 5% type I error level | 10 | 0.666666666666667 | NOK |
| 10% type I error level | 11 | 0.733333333333333 | NOK |