| Multiple Linear Regression - Estimated Regression Equation |
| Y[t] = + 8.55716459197787 -0.68222683264177X[t] -0.161867219917016M1[t] -0.320933609958506M2[t] -0.448222683264177M3[t] -0.200933609958506M4[t] + 0.0435546334716457M5[t] + 0.259066390041494M6[t] + 0.206355463347164M7[t] + 0.0527109266943289M8[t] -0.167289073305671M9[t] -0.326355463347165M10[t] -0.0145781466113415M11[t] + e[t] |
| Multiple Linear Regression - Ordinary Least Squares | |||||
| Variable | Parameter | S.D. | T-STAT H0: parameter = 0 | 2-tail p-value | 1-tail p-value |
| (Intercept) | 8.55716459197787 | 0.365596 | 23.4061 | 0 | 0 |
| X | -0.68222683264177 | 0.135202 | -5.046 | 7e-06 | 4e-06 |
| M1 | -0.161867219917016 | 0.356564 | -0.454 | 0.651944 | 0.325972 |
| M2 | -0.320933609958506 | 0.356287 | -0.9008 | 0.372302 | 0.186151 |
| M3 | -0.448222683264177 | 0.356452 | -1.2575 | 0.2148 | 0.1074 |
| M4 | -0.200933609958506 | 0.356287 | -0.564 | 0.575459 | 0.28773 |
| M5 | 0.0435546334716457 | 0.35722 | 0.1219 | 0.903477 | 0.451738 |
| M6 | 0.259066390041494 | 0.356287 | 0.7271 | 0.470754 | 0.235377 |
| M7 | 0.206355463347164 | 0.356205 | 0.5793 | 0.565142 | 0.282571 |
| M8 | 0.0527109266943289 | 0.356236 | 0.148 | 0.883002 | 0.441501 |
| M9 | -0.167289073305671 | 0.356236 | -0.4696 | 0.640811 | 0.320406 |
| M10 | -0.326355463347165 | 0.356205 | -0.9162 | 0.364239 | 0.182119 |
| M11 | -0.0145781466113415 | 0.356359 | -0.0409 | 0.967542 | 0.483771 |
| Multiple Linear Regression - Regression Statistics | |
| Multiple R | 0.647973621712503 |
| R-squared | 0.419869814435218 |
| Adjusted R-squared | 0.271751469184636 |
| F-TEST (value) | 2.83469150107567 |
| F-TEST (DF numerator) | 12 |
| F-TEST (DF denominator) | 47 |
| p-value | 0.00529516321303269 |
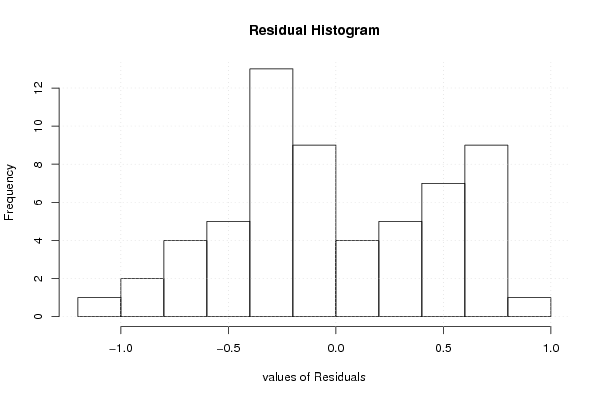
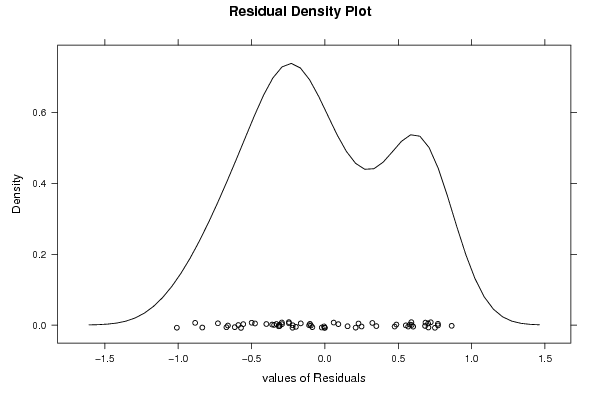
| Multiple Linear Regression - Residual Statistics | |
| Residual Standard Deviation | 0.563193756674525 |
| Sum Squared Residuals | 14.9077987551867 |
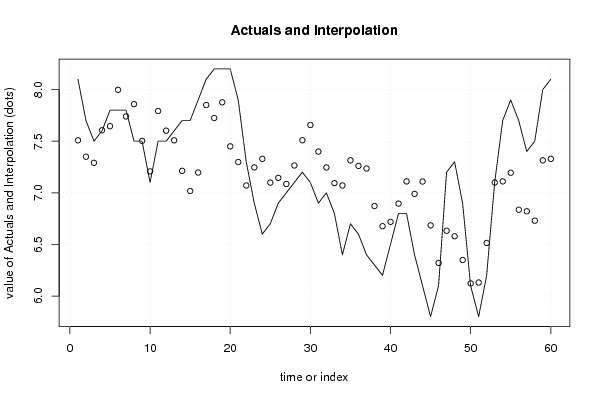
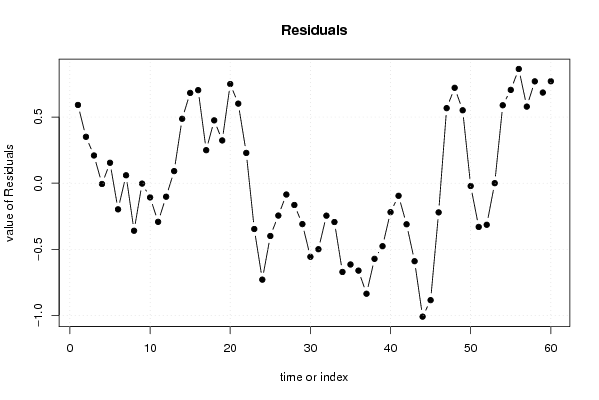
| Multiple Linear Regression - Actuals, Interpolation, and Residuals | |||
| Time or Index | Actuals | Interpolation Forecast | Residuals Prediction Error |
| 1 | 8.1 | 7.50840248962657 | 0.591597510373431 |
| 2 | 7.7 | 7.34933609958506 | 0.350663900414938 |
| 3 | 7.5 | 7.29026970954357 | 0.209730290456432 |
| 4 | 7.6 | 7.60578146611342 | -0.00578146611341634 |
| 5 | 7.8 | 7.64560165975104 | 0.154398340248963 |
| 6 | 7.8 | 7.99755878284924 | -0.197558782849239 |
| 7 | 7.8 | 7.74017980636238 | 0.0598201936376213 |
| 8 | 7.5 | 7.85942600276625 | -0.359426002766251 |
| 9 | 7.5 | 7.5029806362379 | -0.00298063623789704 |
| 10 | 7.1 | 7.20746887966805 | -0.107468879668050 |
| 11 | 7.5 | 7.79213692946058 | -0.292136929460580 |
| 12 | 7.5 | 7.60204702627939 | -0.102047026279391 |
| 13 | 7.6 | 7.50840248962655 | 0.0915975103734475 |
| 14 | 7.7 | 7.21289073305671 | 0.487109266943292 |
| 15 | 7.7 | 7.01737897648686 | 0.68262102351314 |
| 16 | 7.9 | 7.19644536652835 | 0.703554633471647 |
| 17 | 8.1 | 7.85026970954357 | 0.249730290456432 |
| 18 | 8.2 | 7.72466804979253 | 0.475331950207469 |
| 19 | 8.2 | 7.87662517289073 | 0.323374827109267 |
| 20 | 8.2 | 7.45008990318119 | 0.74991009681881 |
| 21 | 7.9 | 7.29831258644537 | 0.601687413554634 |
| 22 | 7.3 | 7.0710235131397 | 0.228976486860305 |
| 23 | 6.9 | 7.24635546334716 | -0.346355463347164 |
| 24 | 6.6 | 7.32915629322268 | -0.729156293222683 |
| 25 | 6.7 | 7.09906639004149 | -0.39906639004149 |
| 26 | 6.9 | 7.14466804979253 | -0.244668049792531 |
| 27 | 7 | 7.08560165975104 | -0.0856016597510371 |
| 28 | 7.1 | 7.26466804979253 | -0.164668049792531 |
| 29 | 7.2 | 7.50915629322268 | -0.309156293222683 |
| 30 | 7.1 | 7.65644536652835 | -0.556445366528354 |
| 31 | 6.9 | 7.3990663900415 | -0.499066390041494 |
| 32 | 7 | 7.24542185338866 | -0.245421853388658 |
| 33 | 6.8 | 7.09364453665284 | -0.293644536652836 |
| 34 | 6.4 | 7.0710235131397 | -0.671023513139695 |
| 35 | 6.7 | 7.31457814661134 | -0.614578146611341 |
| 36 | 6.6 | 7.2609336099585 | -0.660933609958506 |
| 37 | 6.4 | 7.23551175656984 | -0.835511756569844 |
| 38 | 6.3 | 6.87177731673582 | -0.571777316735823 |
| 39 | 6.2 | 6.67626556016597 | -0.476265560165975 |
| 40 | 6.5 | 6.71888658367912 | -0.218886583679115 |
| 41 | 6.8 | 6.89515214384509 | -0.0951521438450902 |
| 42 | 6.8 | 7.11066390041494 | -0.310663900414938 |
| 43 | 6.4 | 6.98973029045643 | -0.589730290456431 |
| 44 | 6.1 | 7.1089764868603 | -1.00897648686030 |
| 45 | 5.8 | 6.68430843706777 | -0.884308437067774 |
| 46 | 6.1 | 6.32057399723375 | -0.220573997233749 |
| 47 | 7.2 | 6.63235131396957 | 0.567648686030428 |
| 48 | 7.3 | 6.57870677731674 | 0.721293222683264 |
| 49 | 6.9 | 6.34861687413554 | 0.551383125864457 |
| 50 | 6.1 | 6.12132780082988 | -0.0213278008298763 |
| 51 | 5.8 | 6.13048409405256 | -0.330484094052560 |
| 52 | 6.2 | 6.51421853388658 | -0.314218533886584 |
| 53 | 7.1 | 7.09982019363762 | 0.000179806362378812 |
| 54 | 7.7 | 7.11066390041494 | 0.589336099585062 |
| 55 | 7.9 | 7.19439834024896 | 0.705601659751037 |
| 56 | 7.7 | 6.8360857538036 | 0.863914246196404 |
| 57 | 7.4 | 6.82075380359613 | 0.579246196403873 |
| 58 | 7.5 | 6.72991009681881 | 0.77008990318119 |
| 59 | 8 | 7.31457814661134 | 0.685421853388658 |
| 60 | 8.1 | 7.32915629322268 | 0.770843706777317 |
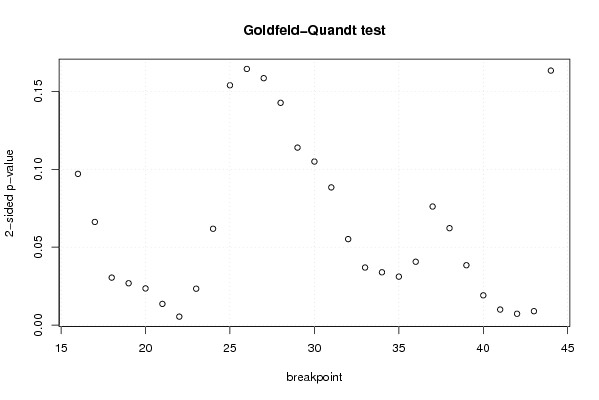
| Goldfeld-Quandt test for Heteroskedasticity | |||
| p-values | Alternative Hypothesis | ||
| breakpoint index | greater | 2-sided | less |
| 16 | 0.0485142983165755 | 0.0970285966331509 | 0.951485701683425 |
| 17 | 0.0330873435801727 | 0.0661746871603455 | 0.966912656419827 |
| 18 | 0.0152342514199236 | 0.0304685028398473 | 0.984765748580076 |
| 19 | 0.0134188015201041 | 0.0268376030402081 | 0.986581198479896 |
| 20 | 0.0117641004694838 | 0.0235282009389676 | 0.988235899530516 |
| 21 | 0.00680012348443746 | 0.0136002469688749 | 0.993199876515563 |
| 22 | 0.00270587504064089 | 0.00541175008128177 | 0.99729412495936 |
| 23 | 0.0116741509858868 | 0.0233483019717735 | 0.988325849014113 |
| 24 | 0.0309054120982048 | 0.0618108241964096 | 0.969094587901795 |
| 25 | 0.0769453133487094 | 0.153890626697419 | 0.92305468665129 |
| 26 | 0.082181163672838 | 0.164362327345676 | 0.917818836327162 |
| 27 | 0.0792176718341745 | 0.158435343668349 | 0.920782328165826 |
| 28 | 0.0713152189326125 | 0.142630437865225 | 0.928684781067387 |
| 29 | 0.0569354637389486 | 0.113870927477897 | 0.943064536261051 |
| 30 | 0.0524654116762258 | 0.104930823352452 | 0.947534588323774 |
| 31 | 0.0441801173162616 | 0.0883602346325231 | 0.955819882683738 |
| 32 | 0.0275844831331629 | 0.0551689662663259 | 0.972415516866837 |
| 33 | 0.0184694965281991 | 0.0369389930563982 | 0.9815305034718 |
| 34 | 0.0169402631167168 | 0.0338805262334336 | 0.983059736883283 |
| 35 | 0.0155394001939312 | 0.0310788003878624 | 0.984460599806069 |
| 36 | 0.0203239674259229 | 0.0406479348518457 | 0.979676032574077 |
| 37 | 0.0380344466279424 | 0.0760688932558848 | 0.961965553372058 |
| 38 | 0.0310947013714862 | 0.0621894027429723 | 0.968905298628514 |
| 39 | 0.0192025756735674 | 0.0384051513471347 | 0.980797424326433 |
| 40 | 0.00954221353998928 | 0.0190844270799786 | 0.99045778646001 |
| 41 | 0.00498148021680104 | 0.00996296043360208 | 0.995018519783199 |
| 42 | 0.00363184412360111 | 0.00726368824720222 | 0.996368155876399 |
| 43 | 0.00445772774181618 | 0.00891545548363236 | 0.995542272258184 |
| 44 | 0.081652540413984 | 0.163305080827968 | 0.918347459586016 |
| Meta Analysis of Goldfeld-Quandt test for Heteroskedasticity | |||
| Description | # significant tests | % significant tests | OK/NOK |
| 1% type I error level | 4 | 0.137931034482759 | NOK |
| 5% type I error level | 15 | 0.517241379310345 | NOK |
| 10% type I error level | 22 | 0.758620689655172 | NOK |