| Multiple Linear Regression - Estimated Regression Equation |
| saldo_zichtrek[t] = + 32.8617038709678 -0.55318467741935crisis[t] -1.08223211917562M1[t] -1.72115552867384M2[t] -2.26926673387097M3[t] -0.965814874551973M4[t] -1.46756301523298M5[t] -0.99851115591398M6[t] -0.881859296594985M7[t] -0.751807437275987M8[t] -0.231355577956992M9[t] + 1.43949628136201M10[t] + 1.593148140681M11[t] + 0.0899481406810033t + e[t] |
| Multiple Linear Regression - Ordinary Least Squares | |||||
| Variable | Parameter | S.D. | T-STAT H0: parameter = 0 | 2-tail p-value | 1-tail p-value |
| (Intercept) | 32.8617038709678 | 0.908805 | 36.1592 | 0 | 0 |
| crisis | -0.55318467741935 | 0.761496 | -0.7264 | 0.471169 | 0.235585 |
| M1 | -1.08223211917562 | 1.019167 | -1.0619 | 0.293716 | 0.146858 |
| M2 | -1.72115552867384 | 1.07 | -1.6086 | 0.114411 | 0.057206 |
| M3 | -2.26926673387097 | 1.072621 | -2.1156 | 0.039704 | 0.019852 |
| M4 | -0.965814874551973 | 1.070408 | -0.9023 | 0.371505 | 0.185753 |
| M5 | -1.46756301523298 | 1.068451 | -1.3735 | 0.1761 | 0.08805 |
| M6 | -0.99851115591398 | 1.066752 | -0.936 | 0.354043 | 0.177022 |
| M7 | -0.881859296594985 | 1.065313 | -0.8278 | 0.411971 | 0.205986 |
| M8 | -0.751807437275987 | 1.064134 | -0.7065 | 0.483367 | 0.241683 |
| M9 | -0.231355577956992 | 1.063216 | -0.2176 | 0.828683 | 0.414341 |
| M10 | 1.43949628136201 | 1.06256 | 1.3547 | 0.181976 | 0.090988 |
| M11 | 1.593148140681 | 1.062166 | 1.4999 | 0.140327 | 0.070163 |
| t | 0.0899481406810033 | 0.016703 | 5.3852 | 2e-06 | 1e-06 |
| Multiple Linear Regression - Regression Statistics | |
| Multiple R | 0.797953120470371 |
| R-squared | 0.636729182468403 |
| Adjusted R-squared | 0.53625002017243 |
| F-TEST (value) | 6.33692765663034 |
| F-TEST (DF numerator) | 13 |
| F-TEST (DF denominator) | 47 |
| p-value | 1.07600384402495e-06 |
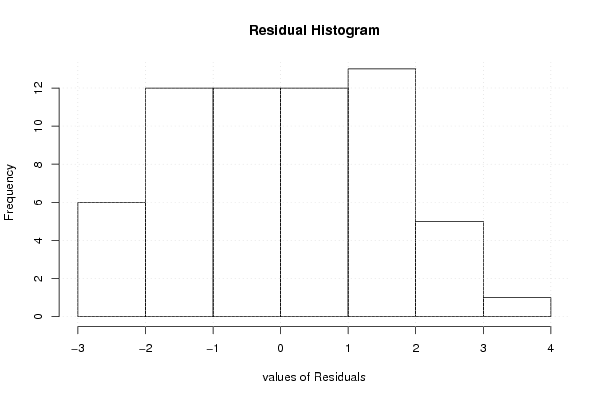
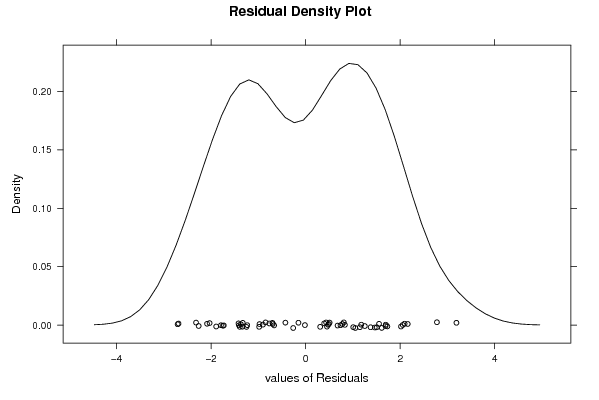
| Multiple Linear Regression - Residual Statistics | |
| Residual Standard Deviation | 1.67922394172143 |
| Sum Squared Residuals | 132.530273183172 |
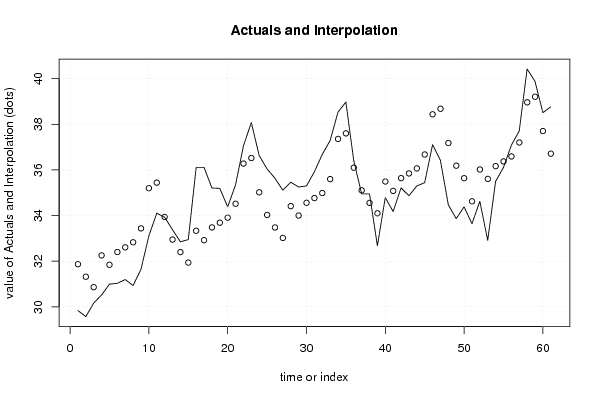
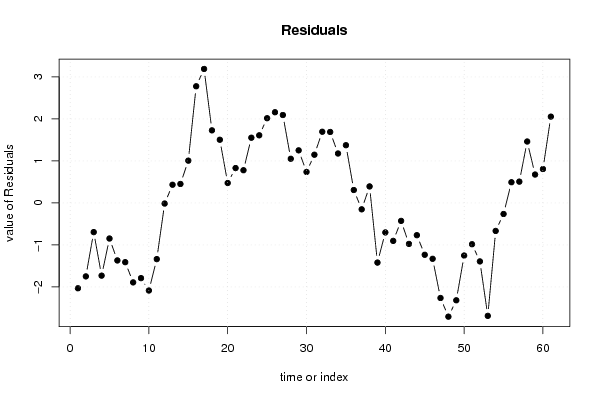
| Multiple Linear Regression - Actuals, Interpolation, and Residuals | |||
| Time or Index | Actuals | Interpolation Forecast | Residuals Prediction Error |
| 1 | 29.837 | 31.8694198924731 | -2.03241989247307 |
| 2 | 29.571 | 31.3204446236559 | -1.74944462365591 |
| 3 | 30.167 | 30.8622815591398 | -0.695281559139789 |
| 4 | 30.524 | 32.2556815591398 | -1.73168155913979 |
| 5 | 30.996 | 31.8438815591398 | -0.847881559139785 |
| 6 | 31.033 | 32.4028815591398 | -1.36988155913979 |
| 7 | 31.198 | 32.6094815591398 | -1.41148155913979 |
| 8 | 30.937 | 32.8294815591398 | -1.89248155913979 |
| 9 | 31.649 | 33.4398815591398 | -1.79088155913979 |
| 10 | 33.115 | 35.2006815591398 | -2.08568155913979 |
| 11 | 34.106 | 35.4442815591398 | -1.33828155913979 |
| 12 | 33.926 | 33.9410815591398 | -0.0150815591397881 |
| 13 | 33.382 | 32.9487975806452 | 0.433202419354821 |
| 14 | 32.851 | 32.3998223118280 | 0.451177688172041 |
| 15 | 32.948 | 31.9416592473118 | 1.00634075268817 |
| 16 | 36.112 | 33.3350592473118 | 2.77694075268817 |
| 17 | 36.113 | 32.9232592473118 | 3.18974075268817 |
| 18 | 35.21 | 33.4822592473118 | 1.72774075268817 |
| 19 | 35.193 | 33.6888592473118 | 1.50414075268817 |
| 20 | 34.383 | 33.9088592473118 | 0.474140752688173 |
| 21 | 35.349 | 34.5192592473118 | 0.829740752688169 |
| 22 | 37.058 | 36.2800592473118 | 0.77794075268817 |
| 23 | 38.076 | 36.5236592473118 | 1.55234075268817 |
| 24 | 36.63 | 35.0204592473118 | 1.60954075268817 |
| 25 | 36.045 | 34.0281752688172 | 2.01682473118279 |
| 26 | 35.638 | 33.4792 | 2.15880000000000 |
| 27 | 35.114 | 33.0210369354839 | 2.09296306451613 |
| 28 | 35.465 | 34.4144369354839 | 1.05056306451613 |
| 29 | 35.254 | 34.0026369354839 | 1.25136306451613 |
| 30 | 35.299 | 34.5616369354839 | 0.73736306451613 |
| 31 | 35.916 | 34.7682369354839 | 1.14776306451613 |
| 32 | 36.683 | 34.9882369354839 | 1.69476306451613 |
| 33 | 37.288 | 35.5986369354839 | 1.68936306451613 |
| 34 | 38.536 | 37.3594369354839 | 1.17656306451613 |
| 35 | 38.977 | 37.6030369354839 | 1.37396306451613 |
| 36 | 36.407 | 36.0998369354839 | 0.307163064516126 |
| 37 | 34.955 | 35.1075529569893 | -0.152552956989258 |
| 38 | 34.951 | 34.5585776881720 | 0.392422311827960 |
| 39 | 32.68 | 34.1004146236559 | -1.42041462365591 |
| 40 | 34.791 | 35.4938146236559 | -0.702814623655914 |
| 41 | 34.178 | 35.0820146236559 | -0.904014623655912 |
| 42 | 35.213 | 35.6410146236559 | -0.42801462365591 |
| 43 | 34.871 | 35.8476146236559 | -0.976614623655907 |
| 44 | 35.299 | 36.0676146236559 | -0.76861462365591 |
| 45 | 35.443 | 36.6780146236559 | -1.23501462365591 |
| 46 | 37.108 | 38.4388146236559 | -1.33081462365591 |
| 47 | 36.419 | 38.6824146236559 | -2.26341462365591 |
| 48 | 34.471 | 37.1792146236559 | -2.70821462365591 |
| 49 | 33.868 | 36.1869306451613 | -2.31893064516129 |
| 50 | 34.385 | 35.6379553763441 | -1.25295537634408 |
| 51 | 33.643 | 34.6266076344086 | -0.9836076344086 |
| 52 | 34.627 | 36.0200076344086 | -1.3930076344086 |
| 53 | 32.919 | 35.6082076344086 | -2.6892076344086 |
| 54 | 35.5 | 36.1672076344086 | -0.667207634408602 |
| 55 | 36.11 | 36.3738076344086 | -0.263807634408602 |
| 56 | 37.086 | 36.5938076344086 | 0.492192365591397 |
| 57 | 37.711 | 37.2042076344086 | 0.506792365591399 |
| 58 | 40.427 | 38.9650076344086 | 1.46199236559140 |
| 59 | 39.884 | 39.2086076344086 | 0.675392365591399 |
| 60 | 38.512 | 37.7054076344086 | 0.806592365591398 |
| 61 | 38.767 | 36.713123655914 | 2.05387634408602 |
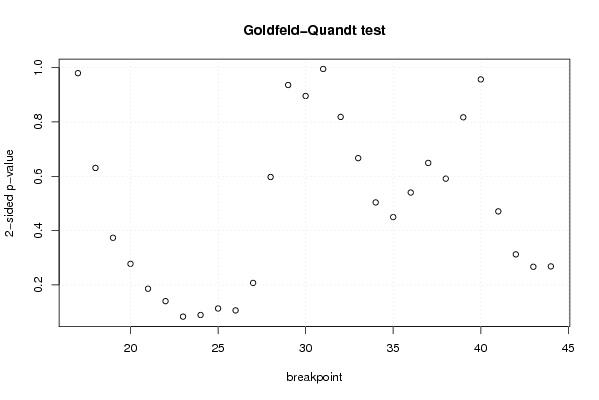
| Goldfeld-Quandt test for Heteroskedasticity | |||
| p-values | Alternative Hypothesis | ||
| breakpoint index | greater | 2-sided | less |
| 17 | 0.489899798911477 | 0.979799597822953 | 0.510100201088523 |
| 18 | 0.315387349780485 | 0.63077469956097 | 0.684612650219515 |
| 19 | 0.186831139465138 | 0.373662278930276 | 0.813168860534862 |
| 20 | 0.138858373743986 | 0.277716747487972 | 0.861141626256014 |
| 21 | 0.0930179676372175 | 0.186035935274435 | 0.906982032362782 |
| 22 | 0.0701561253674618 | 0.140312250734924 | 0.929843874632538 |
| 23 | 0.041612937670937 | 0.083225875341874 | 0.958387062329063 |
| 24 | 0.0446804160789222 | 0.0893608321578443 | 0.955319583921078 |
| 25 | 0.0566661668457133 | 0.113332333691427 | 0.943333833154287 |
| 26 | 0.0531180056332661 | 0.106236011266532 | 0.946881994366734 |
| 27 | 0.103689006871131 | 0.207378013742262 | 0.896310993128869 |
| 28 | 0.298718316038996 | 0.597436632077991 | 0.701281683961004 |
| 29 | 0.531941376633085 | 0.93611724673383 | 0.468058623366915 |
| 30 | 0.552113505662196 | 0.89577298867561 | 0.447886494337804 |
| 31 | 0.502359413908198 | 0.995281172183604 | 0.497640586091802 |
| 32 | 0.409320843457601 | 0.818641686915201 | 0.5906791565424 |
| 33 | 0.333403638696861 | 0.666807277393721 | 0.66659636130314 |
| 34 | 0.25190679485651 | 0.50381358971302 | 0.74809320514349 |
| 35 | 0.224930816438897 | 0.449861632877793 | 0.775069183561103 |
| 36 | 0.270129221339302 | 0.540258442678603 | 0.729870778660698 |
| 37 | 0.324613667354081 | 0.649227334708161 | 0.67538633264592 |
| 38 | 0.295645457340919 | 0.591290914681838 | 0.70435454265908 |
| 39 | 0.408630463586316 | 0.817260927172633 | 0.591369536413684 |
| 40 | 0.478383060735909 | 0.956766121471817 | 0.521616939264091 |
| 41 | 0.76456317278457 | 0.47087365443086 | 0.23543682721543 |
| 42 | 0.843714599731485 | 0.312570800537029 | 0.156285400268515 |
| 43 | 0.866565821229026 | 0.266868357541947 | 0.133434178770974 |
| 44 | 0.865850339329847 | 0.268299321340306 | 0.134149660670153 |
| Meta Analysis of Goldfeld-Quandt test for Heteroskedasticity | |||
| Description | # significant tests | % significant tests | OK/NOK |
| 1% type I error level | 0 | 0 | OK |
| 5% type I error level | 0 | 0 | OK |
| 10% type I error level | 2 | 0.0714285714285714 | OK |