| Multiple Linear Regression - Estimated Regression Equation |
| Y[t] = -0.229569723769742 + 0.0479138564134236X[t] + 1.50956884936896Y1[t] -0.717207139860154Y2[t] -0.234146085893884Y3[t] + 0.425498249765415Y4[t] -0.0822653962756976M1[t] -0.260023264689058M2[t] -0.178609712794115M3[t] -0.118255040027475M4[t] -0.292381316010964M5[t] -0.336368271590958M6[t] + 0.144796624321569M7[t] -0.618739470511963M8[t] -0.331452155750824M9[t] -0.174684003109844M10[t] -0.253211771925874M11[t] + 0.00493334888911443t + e[t] |
| Multiple Linear Regression - Ordinary Least Squares | |||||
| Variable | Parameter | S.D. | T-STAT H0: parameter = 0 | 2-tail p-value | 1-tail p-value |
| (Intercept) | -0.229569723769742 | 0.673358 | -0.3409 | 0.735032 | 0.367516 |
| X | 0.0479138564134236 | 0.070483 | 0.6798 | 0.500759 | 0.250379 |
| Y1 | 1.50956884936896 | 0.154082 | 9.7972 | 0 | 0 |
| Y2 | -0.717207139860154 | 0.286072 | -2.5071 | 0.016567 | 0.008284 |
| Y3 | -0.234146085893884 | 0.28879 | -0.8108 | 0.42254 | 0.21127 |
| Y4 | 0.425498249765415 | 0.161585 | 2.6333 | 0.012161 | 0.006081 |
| M1 | -0.0822653962756976 | 0.143541 | -0.5731 | 0.569944 | 0.284972 |
| M2 | -0.260023264689058 | 0.148693 | -1.7487 | 0.088414 | 0.044207 |
| M3 | -0.178609712794115 | 0.149902 | -1.1915 | 0.240843 | 0.120421 |
| M4 | -0.118255040027475 | 0.149977 | -0.7885 | 0.435304 | 0.217652 |
| M5 | -0.292381316010964 | 0.152041 | -1.923 | 0.061992 | 0.030996 |
| M6 | -0.336368271590958 | 0.150705 | -2.232 | 0.03159 | 0.015795 |
| M7 | 0.144796624321569 | 0.142972 | 1.0128 | 0.317578 | 0.158789 |
| M8 | -0.618739470511963 | 0.156864 | -3.9444 | 0.000333 | 0.000166 |
| M9 | -0.331452155750824 | 0.178646 | -1.8554 | 0.071314 | 0.035657 |
| M10 | -0.174684003109844 | 0.158005 | -1.1056 | 0.275867 | 0.137934 |
| M11 | -0.253211771925874 | 0.147162 | -1.7206 | 0.093451 | 0.046726 |
| t | 0.00493334888911443 | 0.003294 | 1.4978 | 0.14245 | 0.071225 |
| Multiple Linear Regression - Regression Statistics | |
| Multiple R | 0.966040857003575 |
| R-squared | 0.933234937400201 |
| Adjusted R-squared | 0.903366356763449 |
| F-TEST (value) | 31.2447032133792 |
| F-TEST (DF numerator) | 17 |
| F-TEST (DF denominator) | 38 |
| p-value | 0 |
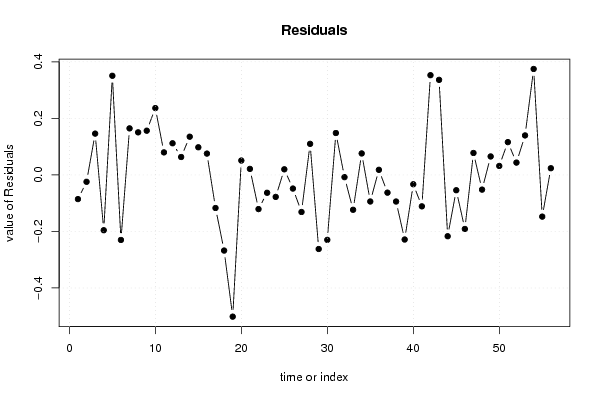
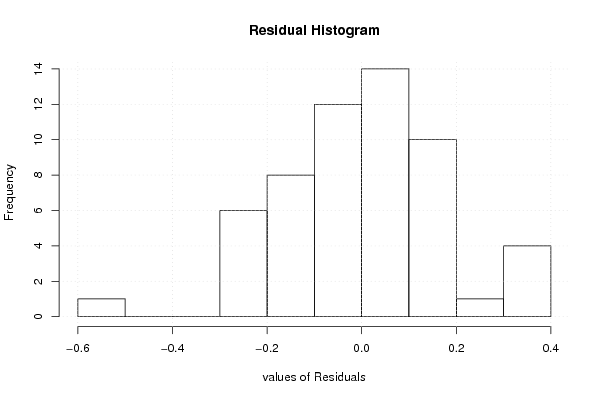
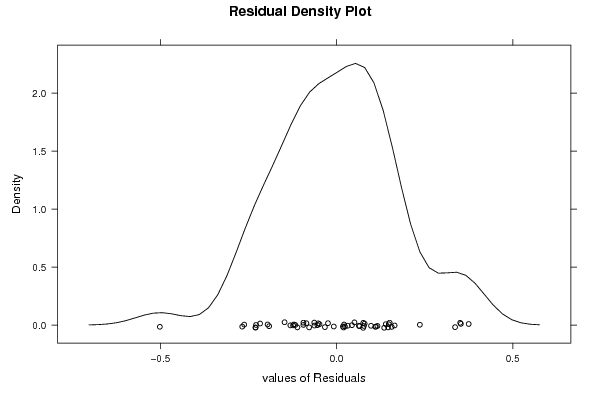
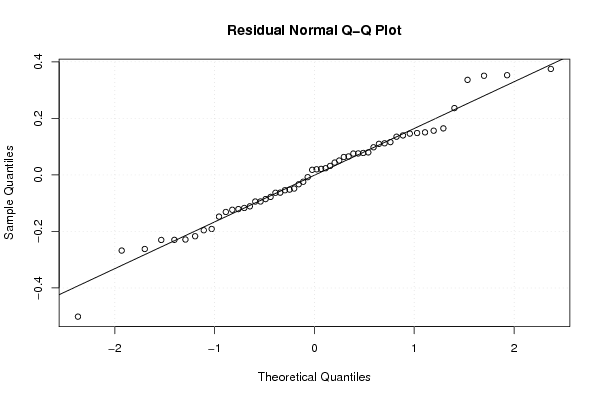
| Multiple Linear Regression - Residual Statistics | |
| Residual Standard Deviation | 0.206139248157389 |
| Sum Squared Residuals | 1.61474880597395 |
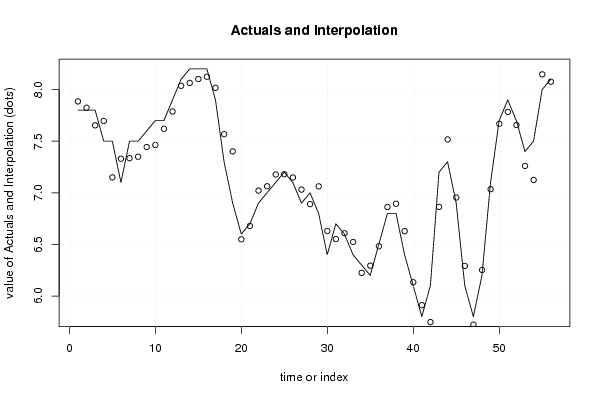
| Multiple Linear Regression - Actuals, Interpolation, and Residuals | |||
| Time or Index | Actuals | Interpolation Forecast | Residuals Prediction Error |
| 1 | 7.8 | 7.8855605327411 | -0.0855605327411074 |
| 2 | 7.8 | 7.82435037201857 | -0.0243503720185753 |
| 3 | 7.8 | 7.65395020064679 | 0.146049799353210 |
| 4 | 7.5 | 7.69579328753494 | -0.195793287534939 |
| 5 | 7.5 | 7.14924658430028 | 0.350753415699724 |
| 6 | 7.1 | 7.33014650520879 | -0.230146505208786 |
| 7 | 7.5 | 7.33536627808577 | 0.164633721914228 |
| 8 | 7.5 | 7.34940722418606 | 0.150592775813939 |
| 9 | 7.6 | 7.44361208060846 | 0.156387919391535 |
| 10 | 7.7 | 7.46366441896368 | 0.236335581036319 |
| 11 | 7.7 | 7.62033992732844 | 0.0796600726715576 |
| 12 | 7.9 | 7.78814111120937 | 0.111858888790630 |
| 13 | 8.1 | 8.03664943572507 | 0.0633505642749256 |
| 14 | 8.2 | 8.06484708307913 | 0.135152916920870 |
| 15 | 8.2 | 8.10229745236659 | 0.0977025476334083 |
| 16 | 8.2 | 8.12455242152795 | 0.0754475784720476 |
| 17 | 7.9 | 8.01704453579727 | -0.117044535797272 |
| 18 | 7.3 | 7.56767009927225 | -0.267670099272247 |
| 19 | 6.9 | 7.4015202615413 | -0.501520261541295 |
| 20 | 6.6 | 6.54924085681624 | 0.0507591431837624 |
| 21 | 6.7 | 6.67872912692389 | 0.0212708730761152 |
| 22 | 6.9 | 7.02095221164052 | -0.120952211640516 |
| 23 | 7 | 7.06322121653935 | -0.063221216539349 |
| 24 | 7.1 | 7.17781771080019 | -0.0778177108001891 |
| 25 | 7.2 | 7.18023382780359 | 0.0197661721964073 |
| 26 | 7.1 | 7.14833052059392 | -0.0483305205939237 |
| 27 | 6.9 | 7.03113503884222 | -0.131135038842221 |
| 28 | 7 | 6.8901566066387 | 0.109843393361305 |
| 29 | 6.8 | 7.06216088345381 | -0.262160883453809 |
| 30 | 6.4 | 6.62979525689864 | -0.229795256898644 |
| 31 | 6.7 | 6.5517845170236 | 0.148215482976396 |
| 32 | 6.6 | 6.60794016706523 | -0.00794016706522784 |
| 33 | 6.4 | 6.52343504565964 | -0.123435045659639 |
| 34 | 6.3 | 6.22408313691031 | 0.0759168630896873 |
| 35 | 6.2 | 6.29403734353754 | -0.0940373435375424 |
| 36 | 6.5 | 6.48201707124523 | 0.0179829287547712 |
| 37 | 6.8 | 6.86279996565031 | -0.0627999656503122 |
| 38 | 6.8 | 6.89417458566753 | -0.0941745856675275 |
| 39 | 6.4 | 6.62860876554212 | -0.228608765542120 |
| 40 | 6.1 | 6.13310073968772 | -0.0331007396877239 |
| 41 | 5.8 | 5.91119533173232 | -0.11119533173232 |
| 42 | 6.1 | 5.74725718911172 | 0.352742810888278 |
| 43 | 7.2 | 6.86372076988155 | 0.336279230118454 |
| 44 | 7.3 | 7.51703289533019 | -0.217032895330191 |
| 45 | 6.9 | 6.95422374680801 | -0.0542237468080115 |
| 46 | 6.1 | 6.29130023248549 | -0.191300232485491 |
| 47 | 5.8 | 5.72240151259467 | 0.0775984874053338 |
| 48 | 6.2 | 6.25202410674521 | -0.0520241067452122 |
| 49 | 7.1 | 7.03475623807991 | 0.0652437619200868 |
| 50 | 7.7 | 7.66829743864084 | 0.0317025613591568 |
| 51 | 7.9 | 7.78400854260228 | 0.115991457397723 |
| 52 | 7.7 | 7.65639694461069 | 0.0436030553893108 |
| 53 | 7.4 | 7.26035266471632 | 0.139647335283677 |
| 54 | 7.5 | 7.1251309495086 | 0.374869050491399 |
| 55 | 8 | 8.14760817346778 | -0.147608173467783 |
| 56 | 8.1 | 8.07637885660228 | 0.0236211433977181 |
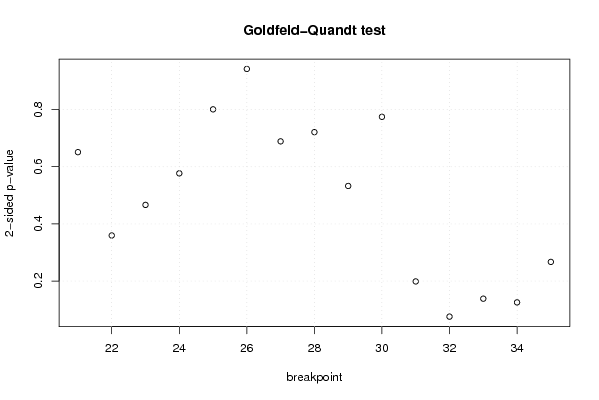
| Goldfeld-Quandt test for Heteroskedasticity | |||
| p-values | Alternative Hypothesis | ||
| breakpoint index | greater | 2-sided | less |
| 21 | 0.32541475443312 | 0.65082950886624 | 0.67458524556688 |
| 22 | 0.820253800721795 | 0.359492398556409 | 0.179746199278205 |
| 23 | 0.766792812232145 | 0.466414375535709 | 0.233207187767855 |
| 24 | 0.711626308549592 | 0.576747382900816 | 0.288373691450408 |
| 25 | 0.599737295415911 | 0.800525409168177 | 0.400262704584089 |
| 26 | 0.470884944898182 | 0.941769889796364 | 0.529115055101818 |
| 27 | 0.344281758253805 | 0.68856351650761 | 0.655718241746195 |
| 28 | 0.360391591639626 | 0.720783183279253 | 0.639608408360373 |
| 29 | 0.266292630237592 | 0.532585260475185 | 0.733707369762408 |
| 30 | 0.61284970530034 | 0.774300589399321 | 0.387150294699660 |
| 31 | 0.900614048123803 | 0.198771903752395 | 0.0993859518761975 |
| 32 | 0.962177842371953 | 0.0756443152560946 | 0.0378221576280473 |
| 33 | 0.930751491949068 | 0.138497016101864 | 0.069248508050932 |
| 34 | 0.937233358996566 | 0.125533282006868 | 0.0627666410034339 |
| 35 | 0.866462961408853 | 0.267074077182294 | 0.133537038591147 |
| Meta Analysis of Goldfeld-Quandt test for Heteroskedasticity | |||
| Description | # significant tests | % significant tests | OK/NOK |
| 1% type I error level | 0 | 0 | OK |
| 5% type I error level | 0 | 0 | OK |
| 10% type I error level | 1 | 0.0666666666666667 | OK |