| Multiple Linear Regression - Estimated Regression Equation |
| Y[t] = -0.153940288710229 -1.33201916470280e-05X[t] + 1.50648070929122Y1[t] -0.65589035973249Y2[t] -0.318048099574336Y3[t] + 0.479226132320903Y4[t] + 0.261087080885896M1[t] + 0.167093825083992M2[t] -0.0136708658093534M3[t] + 0.0604414740927271M4[t] + 0.119159398487352M5[t] -0.0631487681125825M6[t] -0.114763643209317M7[t] + 0.414158022941514M8[t] -0.309959829379935M9[t] -0.132693479589635M10[t] + 0.116449777839318M11[t] + 0.00303282565484625t + e[t] |
| Multiple Linear Regression - Ordinary Least Squares | |||||
| Variable | Parameter | S.D. | T-STAT H0: parameter = 0 | 2-tail p-value | 1-tail p-value |
| (Intercept) | -0.153940288710229 | 0.620335 | -0.2482 | 0.805315 | 0.402658 |
| X | -1.33201916470280e-05 | 6.1e-05 | -0.2186 | 0.828078 | 0.414039 |
| Y1 | 1.50648070929122 | 0.144024 | 10.4599 | 0 | 0 |
| Y2 | -0.65589035973249 | 0.271473 | -2.416 | 0.020472 | 0.010236 |
| Y3 | -0.318048099574336 | 0.271425 | -1.1718 | 0.248397 | 0.124199 |
| Y4 | 0.479226132320903 | 0.15291 | 3.134 | 0.003269 | 0.001635 |
| M1 | 0.261087080885896 | 0.139492 | 1.8717 | 0.068763 | 0.034382 |
| M2 | 0.167093825083992 | 0.148317 | 1.1266 | 0.266796 | 0.133398 |
| M3 | -0.0136708658093534 | 0.149317 | -0.0916 | 0.927519 | 0.46376 |
| M4 | 0.0604414740927271 | 0.147845 | 0.4088 | 0.68491 | 0.342455 |
| M5 | 0.119159398487352 | 0.145601 | 0.8184 | 0.418103 | 0.209052 |
| M6 | -0.0631487681125825 | 0.144089 | -0.4383 | 0.663613 | 0.331807 |
| M7 | -0.114763643209317 | 0.141841 | -0.8091 | 0.423367 | 0.211683 |
| M8 | 0.414158022941514 | 0.140606 | 2.9455 | 0.005414 | 0.002707 |
| M9 | -0.309959829379935 | 0.162573 | -1.9066 | 0.063961 | 0.03198 |
| M10 | -0.132693479589635 | 0.174477 | -0.7605 | 0.451516 | 0.225758 |
| M11 | 0.116449777839318 | 0.155165 | 0.7505 | 0.457465 | 0.228732 |
| t | 0.00303282565484625 | 0.002601 | 1.1661 | 0.250662 | 0.125331 |
| Multiple Linear Regression - Regression Statistics | |
| Multiple R | 0.965407731466025 |
| R-squared | 0.932012087974376 |
| Adjusted R-squared | 0.902376331450387 |
| F-TEST (value) | 31.4489048801546 |
| F-TEST (DF numerator) | 17 |
| F-TEST (DF denominator) | 39 |
| p-value | 0 |
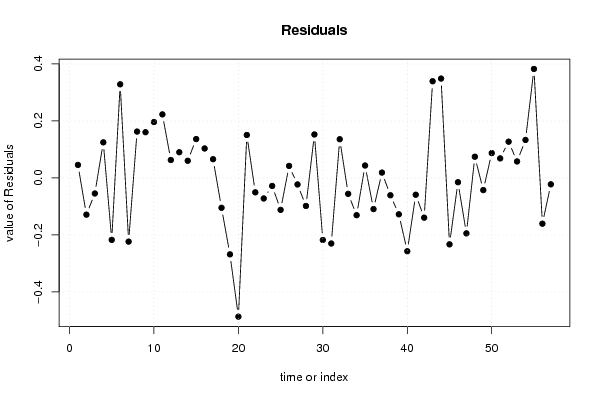
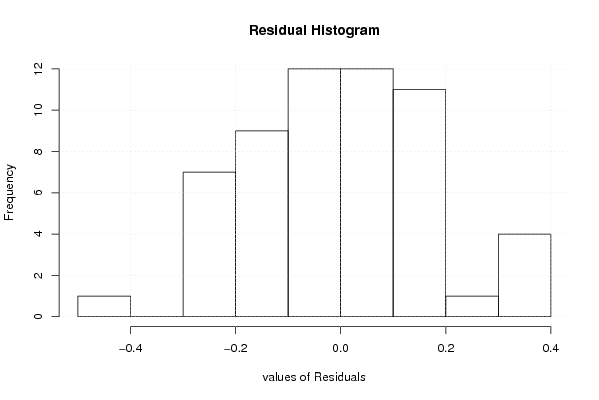
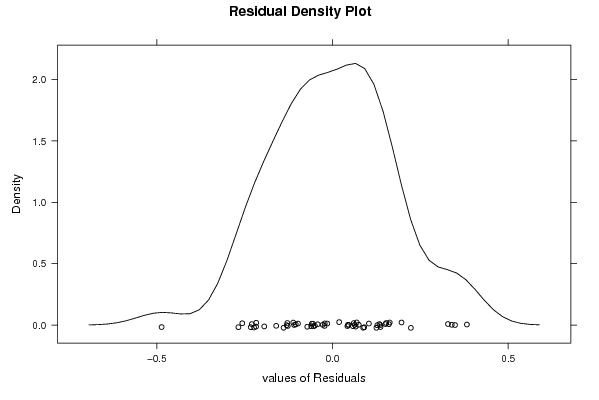
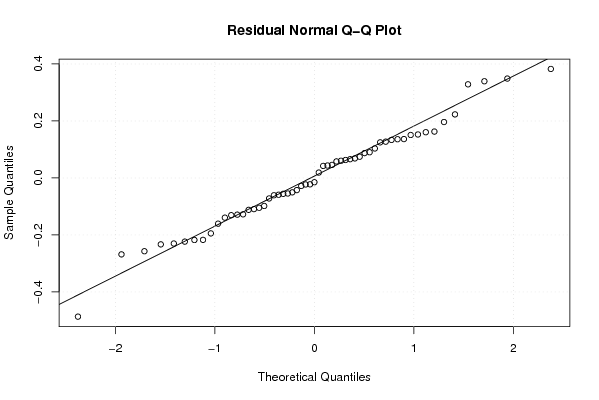
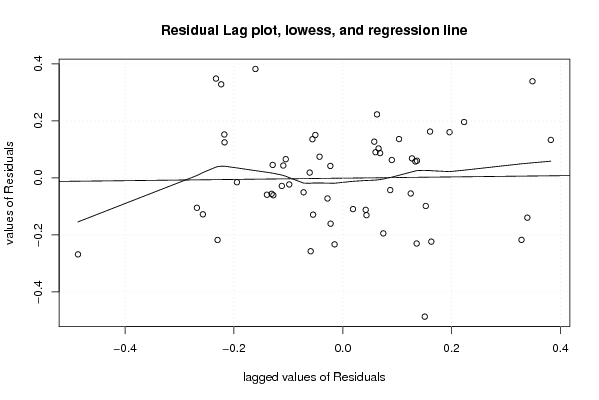
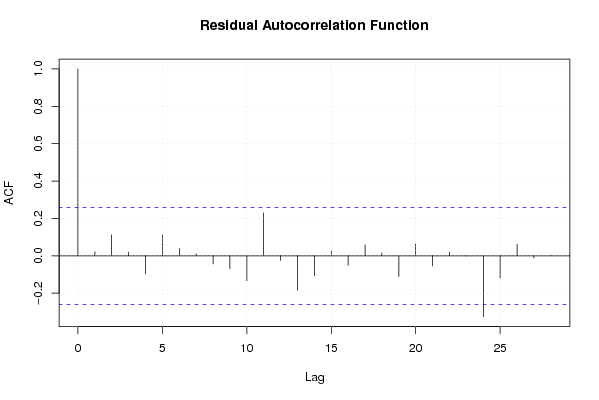
| Multiple Linear Regression - Residual Statistics | |
| Residual Standard Deviation | 0.205821064783154 |
| Sum Squared Residuals | 1.65213011763038 |
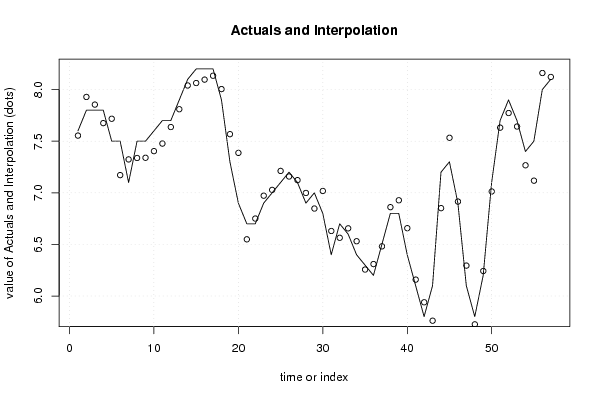
| Multiple Linear Regression - Actuals, Interpolation, and Residuals | |||
| Time or Index | Actuals | Interpolation Forecast | Residuals Prediction Error |
| 1 | 7.6 | 7.55432285149729 | 0.0456771485027087 |
| 2 | 7.8 | 7.92882869955848 | -0.128828699558484 |
| 3 | 7.8 | 7.85456720739761 | -0.0545672073976106 |
| 4 | 7.8 | 7.67508209620819 | 0.124917903791812 |
| 5 | 7.5 | 7.71733626476383 | -0.217336264763833 |
| 6 | 7.5 | 7.1714389860944 | 0.328561013905595 |
| 7 | 7.1 | 7.3234869001499 | -0.223486900149903 |
| 8 | 7.5 | 7.33726105981095 | 0.162738940189054 |
| 9 | 7.5 | 7.33952781229602 | 0.160472187703976 |
| 10 | 7.6 | 7.40372463754151 | 0.196275362458489 |
| 11 | 7.7 | 7.47699626567036 | 0.223003734329639 |
| 12 | 7.7 | 7.63705203422496 | 0.0629479657750442 |
| 13 | 7.9 | 7.80981214165112 | 0.0901878583488803 |
| 14 | 8.1 | 8.03978218723178 | 0.0602178127682218 |
| 15 | 8.2 | 8.06356064730315 | 0.136439352696846 |
| 16 | 8.2 | 8.09657951211948 | 0.103420487880515 |
| 17 | 8.2 | 8.13418108517312 | 0.0658189148268819 |
| 18 | 7.9 | 8.00480011720563 | -0.104800117205631 |
| 19 | 7.3 | 7.5681540578016 | -0.268154057801608 |
| 20 | 6.9 | 7.38679334283643 | -0.486793342836429 |
| 21 | 6.7 | 6.5492807581109 | 0.150719241889097 |
| 22 | 6.7 | 6.75047501942863 | -0.0504750194286303 |
| 23 | 6.9 | 6.97202087343165 | -0.0720208734316533 |
| 24 | 7 | 7.02808957643076 | -0.0280895764307648 |
| 25 | 7.1 | 7.2119980402956 | -0.111998040295607 |
| 26 | 7.2 | 7.15784520615858 | 0.0421547938414226 |
| 27 | 7.1 | 7.12283242058377 | -0.0228324205837740 |
| 28 | 6.9 | 6.99837974124016 | -0.098379741240164 |
| 29 | 7 | 6.84742772776081 | 0.152572272239188 |
| 30 | 6.8 | 7.01775774097348 | -0.217757740973483 |
| 31 | 6.4 | 6.63011221497332 | -0.230112214973319 |
| 32 | 6.7 | 6.56412135468574 | 0.135878645314257 |
| 33 | 6.6 | 6.65578848964908 | -0.0557884896490787 |
| 34 | 6.4 | 6.53074261350347 | -0.130742613503471 |
| 35 | 6.3 | 6.25640369462374 | 0.0435963053762581 |
| 36 | 6.2 | 6.30933262048691 | -0.109332620486913 |
| 37 | 6.5 | 6.48120972969661 | 0.0187902703033876 |
| 38 | 6.8 | 6.86077865691997 | -0.0607786569199721 |
| 39 | 6.8 | 6.92766061319125 | -0.127660613191246 |
| 40 | 6.4 | 6.65718903963511 | -0.257189039635111 |
| 41 | 6.1 | 6.15894659300055 | -0.0589465930005492 |
| 42 | 5.8 | 5.93940554277417 | -0.139405542774169 |
| 43 | 6.1 | 5.76073439763087 | 0.339265602369128 |
| 44 | 7.2 | 6.85129143582018 | 0.348708564179824 |
| 45 | 7.3 | 7.53305037977705 | -0.233050379777047 |
| 46 | 6.9 | 6.91505772952639 | -0.0150577295263880 |
| 47 | 6.1 | 6.29457916627424 | -0.194579166274244 |
| 48 | 5.8 | 5.72552576885737 | 0.0744742311426342 |
| 49 | 6.2 | 6.24265723685937 | -0.0426572368593701 |
| 50 | 7.1 | 7.01276525013119 | 0.0872347498688113 |
| 51 | 7.7 | 7.63137911152422 | 0.0686208884757846 |
| 52 | 7.9 | 7.77276961079705 | 0.127230389202949 |
| 53 | 7.7 | 7.64210832930169 | 0.0578916706983125 |
| 54 | 7.4 | 7.26659761295231 | 0.133402387047689 |
| 55 | 7.5 | 7.1175124294443 | 0.382487570555702 |
| 56 | 8 | 8.1605328068467 | -0.160532806846705 |
| 57 | 8.1 | 8.12235256016695 | -0.0223525601669478 |
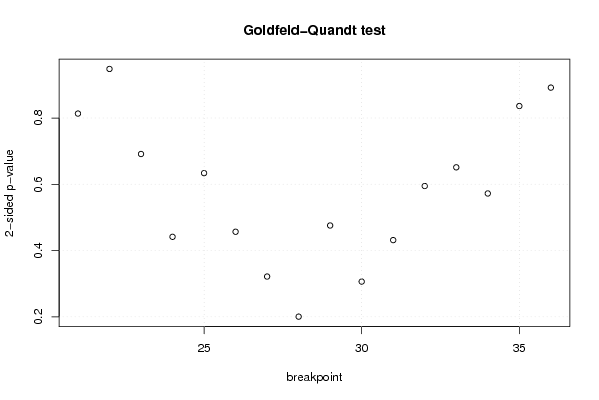
| Goldfeld-Quandt test for Heteroskedasticity | |||
| p-values | Alternative Hypothesis | ||
| breakpoint index | greater | 2-sided | less |
| 21 | 0.593275715207907 | 0.813448569584186 | 0.406724284792093 |
| 22 | 0.474080237815703 | 0.948160475631406 | 0.525919762184297 |
| 23 | 0.345723187406401 | 0.691446374812803 | 0.654276812593598 |
| 24 | 0.220763749575815 | 0.441527499151631 | 0.779236250424185 |
| 25 | 0.316881934505349 | 0.633763869010698 | 0.683118065494651 |
| 26 | 0.228399821903582 | 0.456799643807164 | 0.771600178096418 |
| 27 | 0.160787894853512 | 0.321575789707023 | 0.839212105146488 |
| 28 | 0.100269539388075 | 0.200539078776149 | 0.899730460611925 |
| 29 | 0.237819649524832 | 0.475639299049663 | 0.762180350475168 |
| 30 | 0.153186097428748 | 0.306372194857496 | 0.846813902571252 |
| 31 | 0.215791906412596 | 0.431583812825192 | 0.784208093587404 |
| 32 | 0.297371763921559 | 0.594743527843119 | 0.70262823607844 |
| 33 | 0.325620282693481 | 0.651240565386962 | 0.674379717306519 |
| 34 | 0.286159262927561 | 0.572318525855122 | 0.713840737072439 |
| 35 | 0.418092048661877 | 0.836184097323755 | 0.581907951338122 |
| 36 | 0.554093298880808 | 0.891813402238383 | 0.445906701119192 |
| Meta Analysis of Goldfeld-Quandt test for Heteroskedasticity | |||
| Description | # significant tests | % significant tests | OK/NOK |
| 1% type I error level | 0 | 0 | OK |
| 5% type I error level | 0 | 0 | OK |
| 10% type I error level | 0 | 0 | OK |