| Multiple Linear Regression - Estimated Regression Equation |
| bbp[t] = + 0.283583481329755 + 0.87157532309714dnst[t] + 0.388041478512539y1[t] + 0.000169689182079754y2[t] -0.0877779250738779y3[t] -0.0561761314020608y4[t] + 0.163466937282331M1[t] -0.0834875894043308M2[t] -0.00580475650251201M3[t] -0.00489251410928679M4[t] -0.163817702920595M5[t] -0.156310262467637M6[t] -0.476683426511671M7[t] -0.745738408049973M8[t] -0.343987974397176M9[t] -0.211691278468082M10[t] -0.0699298934146428M11[t] -0.0136047722817271t + e[t] |
| Multiple Linear Regression - Ordinary Least Squares | |||||
| Variable | Parameter | S.D. | T-STAT H0: parameter = 0 | 2-tail p-value | 1-tail p-value |
| (Intercept) | 0.283583481329755 | 0.371119 | 0.7641 | 0.449062 | 0.224531 |
| dnst | 0.87157532309714 | 0.129572 | 6.7266 | 0 | 0 |
| y1 | 0.388041478512539 | 0.135589 | 2.8619 | 0.006539 | 0.00327 |
| y2 | 0.000169689182079754 | 0.144607 | 0.0012 | 0.999069 | 0.499535 |
| y3 | -0.0877779250738779 | 0.148348 | -0.5917 | 0.557221 | 0.27861 |
| y4 | -0.0561761314020608 | 0.108466 | -0.5179 | 0.607237 | 0.303618 |
| M1 | 0.163466937282331 | 0.430814 | 0.3794 | 0.706275 | 0.353137 |
| M2 | -0.0834875894043308 | 0.428772 | -0.1947 | 0.846556 | 0.423278 |
| M3 | -0.00580475650251201 | 0.435481 | -0.0133 | 0.989428 | 0.494714 |
| M4 | -0.00489251410928679 | 0.434877 | -0.0113 | 0.991077 | 0.495538 |
| M5 | -0.163817702920595 | 0.432803 | -0.3785 | 0.706963 | 0.353481 |
| M6 | -0.156310262467637 | 0.429149 | -0.3642 | 0.717511 | 0.358756 |
| M7 | -0.476683426511671 | 0.438455 | -1.0872 | 0.283153 | 0.141577 |
| M8 | -0.745738408049973 | 0.440422 | -1.6932 | 0.097816 | 0.048908 |
| M9 | -0.343987974397176 | 0.448933 | -0.7662 | 0.447822 | 0.223911 |
| M10 | -0.211691278468082 | 0.439268 | -0.4819 | 0.632366 | 0.316183 |
| M11 | -0.0699298934146428 | 0.428518 | -0.1632 | 0.871151 | 0.435576 |
| t | -0.0136047722817271 | 0.005232 | -2.6002 | 0.012805 | 0.006403 |
| Multiple Linear Regression - Regression Statistics | |
| Multiple R | 0.936070244926371 |
| R-squared | 0.876227503436516 |
| Adjusted R-squared | 0.826129111970344 |
| F-TEST (value) | 17.4901324731787 |
| F-TEST (DF numerator) | 17 |
| F-TEST (DF denominator) | 42 |
| p-value | 7.8381745538536e-14 |
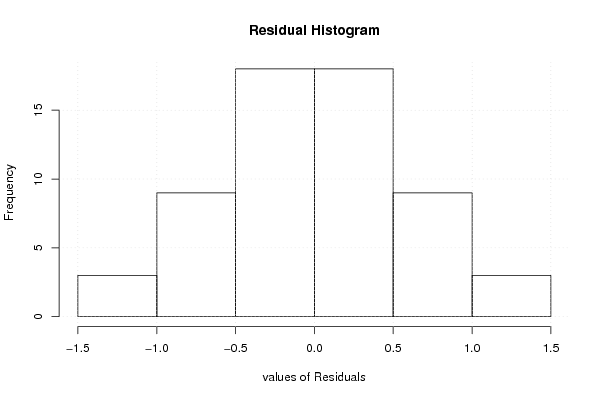
| Multiple Linear Regression - Residual Statistics | |
| Residual Standard Deviation | 0.663394132954228 |
| Sum Squared Residuals | 18.4838545767999 |
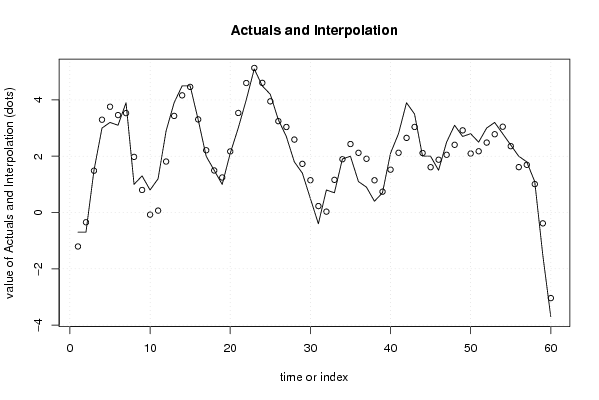
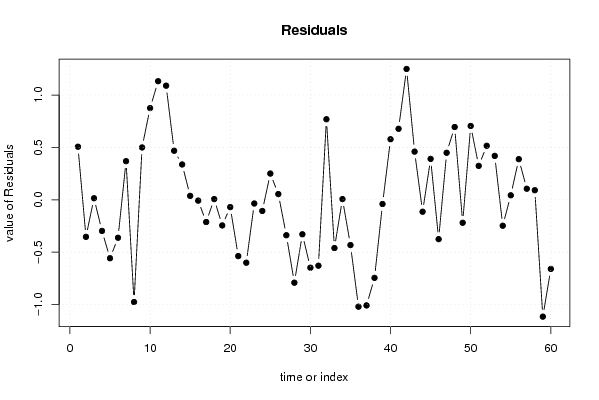
| Multiple Linear Regression - Actuals, Interpolation, and Residuals | |||
| Time or Index | Actuals | Interpolation Forecast | Residuals Prediction Error |
| 1 | -0.7 | -1.20706503097728 | 0.507065030977279 |
| 2 | -0.7 | -0.346661174496943 | -0.353338825503057 |
| 3 | 1.5 | 1.48491893076772 | 0.0150810692322801 |
| 4 | 3 | 3.29666648210517 | -0.29666648210517 |
| 5 | 3.2 | 3.75729963051641 | -0.557299630516412 |
| 6 | 3.1 | 3.46163862838131 | -0.36163862838131 |
| 7 | 3.9 | 3.53089636382307 | 0.369103636176928 |
| 8 | 1 | 1.97515499251186 | -0.975154992511862 |
| 9 | 1.3 | 0.799871022220637 | 0.500128977779363 |
| 10 | 0.8 | -0.0760118238417313 | 0.876011823841731 |
| 11 | 1.2 | 0.0677900340209321 | 1.13220996597907 |
| 12 | 2.9 | 1.81034482246706 | 1.08965517753294 |
| 13 | 3.9 | 3.43139929051556 | 0.468600709484437 |
| 14 | 4.5 | 4.16224956350873 | 0.337750436491273 |
| 15 | 4.5 | 4.46194433985143 | 0.0380556601485679 |
| 16 | 3.3 | 3.30734341960794 | -0.00734341960794171 |
| 17 | 2 | 2.21169066861462 | -0.211690668614617 |
| 18 | 1.5 | 1.49291504424039 | 0.00708495575961385 |
| 19 | 1 | 1.24434434742973 | -0.244344347429733 |
| 20 | 2.1 | 2.16930712237691 | -0.0693071223769058 |
| 21 | 3 | 3.53691916042892 | -0.536919160428917 |
| 22 | 4 | 4.59995729493411 | -0.599957294934111 |
| 23 | 5.1 | 5.13499798691171 | -0.0349979869117128 |
| 24 | 4.5 | 4.6059692233846 | -0.105969223384603 |
| 25 | 4.2 | 3.94906905449367 | 0.250930945506331 |
| 26 | 3.3 | 3.24494858485952 | 0.0550514151404846 |
| 27 | 2.7 | 3.03776895087547 | -0.337768950875472 |
| 28 | 1.8 | 2.59066527304983 | -0.790665273049833 |
| 29 | 1.4 | 1.72886147822480 | -0.328861478224804 |
| 30 | 0.5 | 1.14767491417504 | -0.647674914175043 |
| 31 | -0.4 | 0.228467453684035 | -0.628467453684035 |
| 32 | 0.8 | 0.0307174664691111 | 0.769282533530889 |
| 33 | 0.7 | 1.16014583153810 | -0.460145831538099 |
| 34 | 1.9 | 1.89274107903934 | 0.00725892096066377 |
| 35 | 2 | 2.43175550528109 | -0.431755505281089 |
| 36 | 1.1 | 2.11982470686981 | -1.01982470686981 |
| 37 | 0.9 | 1.90790814548861 | -1.00790814548861 |
| 38 | 0.4 | 1.14476855112512 | -0.744768551125121 |
| 39 | 0.7 | 0.739544324839955 | -0.0395443248399549 |
| 40 | 2.1 | 1.52139622335880 | 0.578603776641196 |
| 41 | 2.8 | 2.12161449237473 | 0.678385507625273 |
| 42 | 3.9 | 2.65061104546766 | 1.24938895453234 |
| 43 | 3.5 | 3.03964324495767 | 0.460356755042335 |
| 44 | 2 | 2.11323229707945 | -0.113232297079453 |
| 45 | 2 | 1.60905379082675 | 0.390946209173255 |
| 46 | 1.5 | 1.87512367080771 | -0.375123670807705 |
| 47 | 2.5 | 2.05055441680450 | 0.449445583195496 |
| 48 | 3.1 | 2.40478530434258 | 0.695214695657419 |
| 49 | 2.7 | 2.91868854047944 | -0.218688540479442 |
| 50 | 2.8 | 2.09469447500358 | 0.705305524996419 |
| 51 | 2.5 | 2.17582345366542 | 0.324176546334578 |
| 52 | 3 | 2.48392860187825 | 0.516071398121749 |
| 53 | 3.2 | 2.78053373026944 | 0.419466269730559 |
| 54 | 2.8 | 3.04716036773560 | -0.247160367735605 |
| 55 | 2.4 | 2.35664859010549 | 0.043351409894506 |
| 56 | 2 | 1.61158812156267 | 0.38841187843733 |
| 57 | 1.8 | 1.69401019498560 | 0.105989805014398 |
| 58 | 1.1 | 1.00818977906058 | 0.0918102209394215 |
| 59 | -1.5 | -0.385097943018238 | -1.11490205698176 |
| 60 | -3.7 | -3.04092405706406 | -0.659075942935939 |
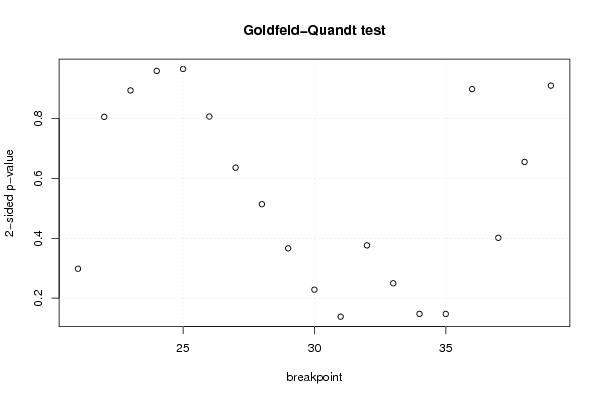
| Goldfeld-Quandt test for Heteroskedasticity | |||
| p-values | Alternative Hypothesis | ||
| breakpoint index | greater | 2-sided | less |
| 21 | 0.149102204524886 | 0.298204409049772 | 0.850897795475114 |
| 22 | 0.597393304070647 | 0.805213391858706 | 0.402606695929353 |
| 23 | 0.553257141217427 | 0.893485717565146 | 0.446742858782573 |
| 24 | 0.520683662061486 | 0.958632675877028 | 0.479316337938514 |
| 25 | 0.482562222989807 | 0.965124445979613 | 0.517437777010193 |
| 26 | 0.403127849650943 | 0.806255699301885 | 0.596872150349057 |
| 27 | 0.317773686859219 | 0.635547373718437 | 0.682226313140782 |
| 28 | 0.256822459806802 | 0.513644919613604 | 0.743177540193198 |
| 29 | 0.183126278477973 | 0.366252556955945 | 0.816873721522027 |
| 30 | 0.114152553759993 | 0.228305107519986 | 0.885847446240007 |
| 31 | 0.0691393071261926 | 0.138278614252385 | 0.930860692873807 |
| 32 | 0.188125852122490 | 0.376251704244980 | 0.81187414787751 |
| 33 | 0.124887452988945 | 0.249774905977889 | 0.875112547011055 |
| 34 | 0.0737701743518672 | 0.147540348703734 | 0.926229825648133 |
| 35 | 0.0736859735771569 | 0.147371947154314 | 0.926314026422843 |
| 36 | 0.551092599144177 | 0.897814801711647 | 0.448907400855823 |
| 37 | 0.799303216727825 | 0.40139356654435 | 0.200696783272175 |
| 38 | 0.672622909646028 | 0.654754180707943 | 0.327377090353972 |
| 39 | 0.545283747082412 | 0.909432505835175 | 0.454716252917588 |
| Meta Analysis of Goldfeld-Quandt test for Heteroskedasticity | |||
| Description | # significant tests | % significant tests | OK/NOK |
| 1% type I error level | 0 | 0 | OK |
| 5% type I error level | 0 | 0 | OK |
| 10% type I error level | 0 | 0 | OK |