| Multiple Linear Regression - Estimated Regression Equation |
| Y[t] = + 0.253786890021161 + 0.117297499777638X[t] + 1.38717974201476Y1[t] -0.594692239920104Y2[t] + 0.142919396207107M1[t] + 0.368637080481907M2[t] + 0.320542671321784M3[t] + 0.0997477098498515M4[t] + 0.076608910371553M5[t] + 0.147111616500441M6[t] + 0.104252609161747M7[t] + 0.121497196855735M8[t] + 0.54958481069371M9[t] -0.162273531176337M10[t] + 0.0200943483296912M11[t] + 0.00233209196489073t + e[t] |
| Multiple Linear Regression - Ordinary Least Squares | |||||
| Variable | Parameter | S.D. | T-STAT H0: parameter = 0 | 2-tail p-value | 1-tail p-value |
| (Intercept) | 0.253786890021161 | 0.737165 | 0.3443 | 0.732358 | 0.366179 |
| X | 0.117297499777638 | 0.073294 | 1.6004 | 0.117012 | 0.058506 |
| Y1 | 1.38717974201476 | 0.128288 | 10.813 | 0 | 0 |
| Y2 | -0.594692239920104 | 0.129254 | -4.601 | 3.8e-05 | 1.9e-05 |
| M1 | 0.142919396207107 | 0.159059 | 0.8985 | 0.374026 | 0.187013 |
| M2 | 0.368637080481907 | 0.157806 | 2.336 | 0.024339 | 0.012169 |
| M3 | 0.320542671321784 | 0.162329 | 1.9746 | 0.054907 | 0.027454 |
| M4 | 0.0997477098498515 | 0.166858 | 0.5978 | 0.553183 | 0.276591 |
| M5 | 0.076608910371553 | 0.163819 | 0.4676 | 0.642456 | 0.321228 |
| M6 | 0.147111616500441 | 0.164765 | 0.8929 | 0.37702 | 0.18851 |
| M7 | 0.104252609161747 | 0.167459 | 0.6226 | 0.536942 | 0.268471 |
| M8 | 0.121497196855735 | 0.163832 | 0.7416 | 0.462459 | 0.23123 |
| M9 | 0.54958481069371 | 0.160308 | 3.4283 | 0.001372 | 0.000686 |
| M10 | -0.162273531176337 | 0.169222 | -0.9589 | 0.343077 | 0.171538 |
| M11 | 0.0200943483296912 | 0.166615 | 0.1206 | 0.90458 | 0.45229 |
| t | 0.00233209196489073 | 0.003531 | 0.6604 | 0.512608 | 0.256304 |
| Multiple Linear Regression - Regression Statistics | |
| Multiple R | 0.95192436469737 |
| R-squared | 0.90615999610449 |
| Adjusted R-squared | 0.872645708998951 |
| F-TEST (value) | 27.0380209267444 |
| F-TEST (DF numerator) | 15 |
| F-TEST (DF denominator) | 42 |
| p-value | 1.11022302462516e-16 |
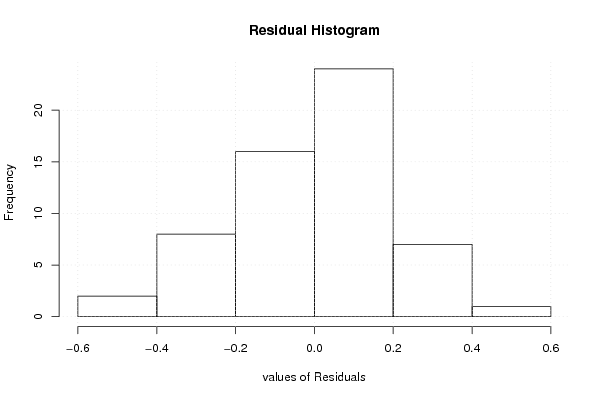
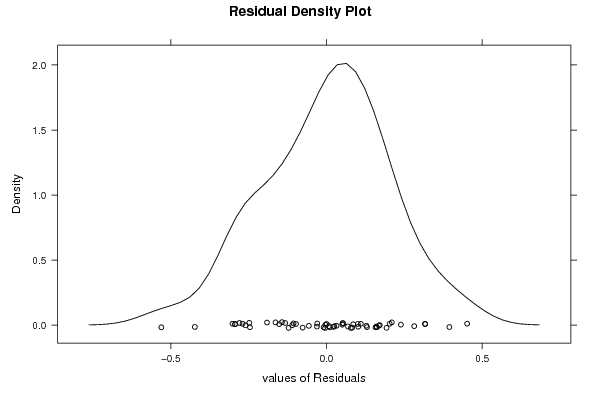
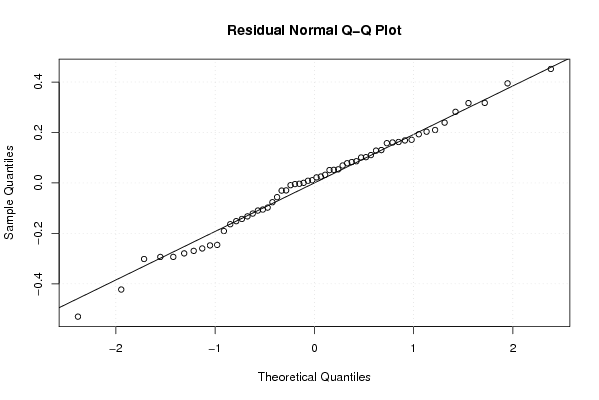
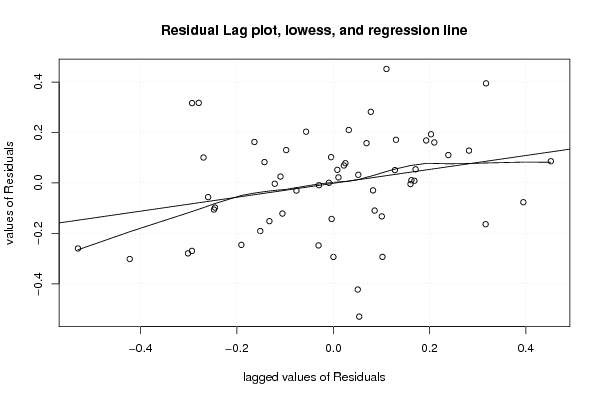
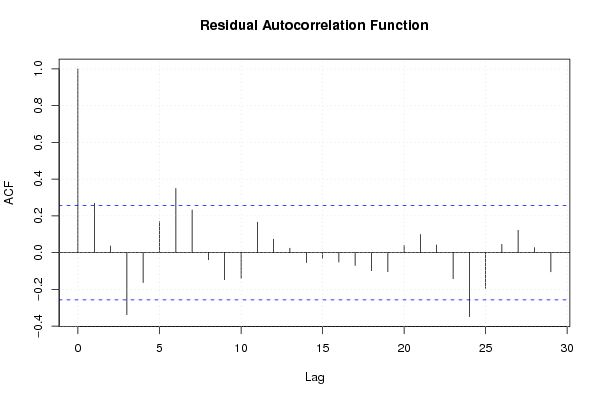
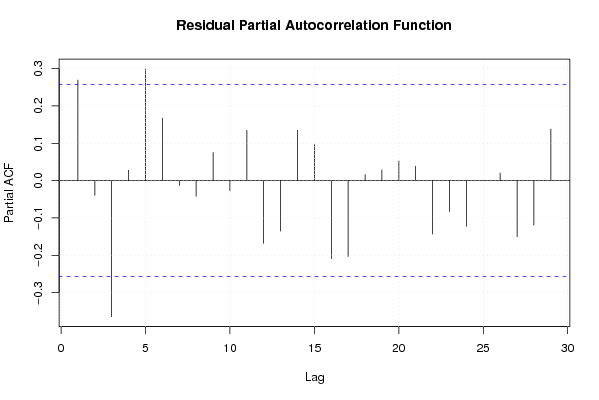
| Multiple Linear Regression - Residual Statistics | |
| Residual Standard Deviation | 0.234084331376249 |
| Sum Squared Residuals | 2.30140991622636 |
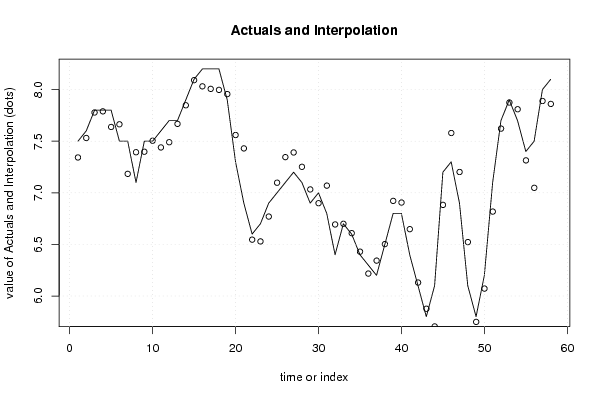
| Multiple Linear Regression - Actuals, Interpolation, and Residuals | |||
| Time or Index | Actuals | Interpolation Forecast | Residuals Prediction Error |
| 1 | 7.5 | 7.34245224630823 | 0.157547753691775 |
| 2 | 7.6 | 7.53094297011301 | 0.0690570298869905 |
| 3 | 7.8 | 7.77802632503656 | 0.0219736749634351 |
| 4 | 7.8 | 7.78925992991823 | 0.0107400700817726 |
| 5 | 7.8 | 7.63778502444304 | 0.162214975556965 |
| 6 | 7.5 | 7.66370082262576 | -0.163700822625758 |
| 7 | 7.5 | 7.183560484692 | 0.316439515307999 |
| 8 | 7.1 | 7.39327458630467 | -0.293274586304675 |
| 9 | 7.5 | 7.39784964505704 | 0.102150354942961 |
| 10 | 7.5 | 7.50453168788135 | -0.00453168788135466 |
| 11 | 7.6 | 7.43962501340647 | 0.160374986593531 |
| 12 | 7.7 | 7.49020223137656 | 0.20979776862344 |
| 13 | 7.7 | 7.66778346984697 | 0.0322165301530307 |
| 14 | 7.9 | 7.84809377207241 | 0.0519062279275875 |
| 15 | 8.1 | 8.0914971532579 | 0.00850284674210331 |
| 16 | 8.2 | 8.03153178416978 | 0.168468215830215 |
| 17 | 8.2 | 8.0070451029183 | 0.192954897081696 |
| 18 | 8.2 | 7.99695117706454 | 0.203048822935455 |
| 19 | 7.9 | 7.95642426169074 | -0.0564242616907414 |
| 20 | 7.3 | 7.5598470187452 | -0.259847018745195 |
| 21 | 6.9 | 7.43020455113735 | -0.530204551137346 |
| 22 | 6.6 | 6.54608124833388 | 0.0539187516661231 |
| 23 | 6.7 | 6.52904469321288 | 0.170955306787119 |
| 24 | 6.9 | 6.76975933313677 | 0.130240666863231 |
| 25 | 7 | 7.09778829578642 | -0.0977882957864174 |
| 26 | 7.1 | 7.34561759824356 | -0.245617598243563 |
| 27 | 7.2 | 7.39083378123556 | -0.190833781235559 |
| 28 | 7.1 | 7.25161966193798 | -0.151619661937984 |
| 29 | 6.9 | 7.03262575623109 | -0.132625756231088 |
| 30 | 7 | 6.89922357989169 | 0.100776420108309 |
| 31 | 6.8 | 7.06943408679233 | -0.269434086792328 |
| 32 | 6.4 | 6.69345684416743 | -0.293456844167426 |
| 33 | 6.7 | 6.69967285112617 | 0.000327148873825966 |
| 34 | 6.6 | 6.6089881698602 | -0.00898816986019411 |
| 35 | 6.4 | 6.42964349524255 | -0.0296434952425499 |
| 36 | 6.3 | 6.21737401442234 | 0.0826259855776623 |
| 37 | 6.2 | 6.34284597637688 | -0.142845976376879 |
| 38 | 6.5 | 6.50337675238487 | -0.00337675238486883 |
| 39 | 6.8 | 6.92150783180831 | -0.121507831808310 |
| 40 | 6.8 | 6.90560196299637 | -0.105601962996373 |
| 41 | 6.4 | 6.64773883361812 | -0.247738833618115 |
| 42 | 6.1 | 6.1305124849727 | -0.0305124849726999 |
| 43 | 5.8 | 5.87651929302922 | -0.0765192930292182 |
| 44 | 6.1 | 5.70526872197076 | 0.394731278029243 |
| 45 | 7.2 | 6.88273677206501 | 0.317263227934990 |
| 46 | 7.3 | 7.57934931628888 | -0.279349316288876 |
| 47 | 6.9 | 7.2016867981381 | -0.301686798138101 |
| 48 | 6.1 | 6.52266442106433 | -0.422664421064333 |
| 49 | 5.8 | 5.74913001168151 | 0.050869988318491 |
| 50 | 6.2 | 6.07196890718615 | 0.128031092813853 |
| 51 | 7.1 | 6.81813490866167 | 0.281865091338331 |
| 52 | 7.7 | 7.62198666097763 | 0.0780133390223694 |
| 53 | 7.9 | 7.87480528278946 | 0.0251947172105426 |
| 54 | 7.7 | 7.80961193544531 | -0.109611935445306 |
| 55 | 7.4 | 7.31406187379571 | 0.0859381262042888 |
| 56 | 7.5 | 7.04815282881195 | 0.451847171188052 |
| 57 | 8 | 7.88953618061443 | 0.110463819385569 |
| 58 | 8.1 | 7.8610495776357 | 0.238950422364302 |
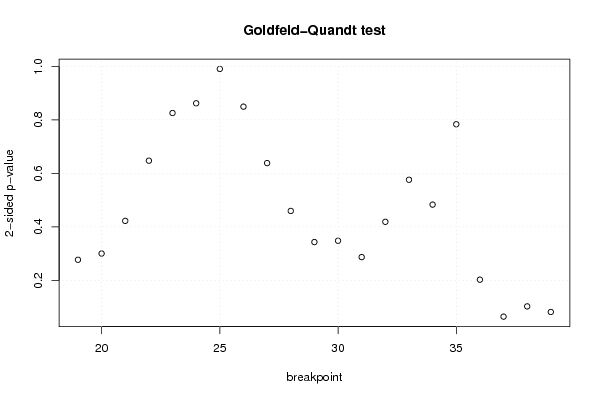
| Goldfeld-Quandt test for Heteroskedasticity | |||
| p-values | Alternative Hypothesis | ||
| breakpoint index | greater | 2-sided | less |
| 19 | 0.138512653293719 | 0.277025306587438 | 0.86148734670628 |
| 20 | 0.150145391476079 | 0.300290782952158 | 0.849854608523921 |
| 21 | 0.788805895566057 | 0.422388208867885 | 0.211194104433943 |
| 22 | 0.67638197174038 | 0.64723605651924 | 0.32361802825962 |
| 23 | 0.587273530095083 | 0.825452939809835 | 0.412726469904917 |
| 24 | 0.569082476781707 | 0.861835046436585 | 0.430917523218293 |
| 25 | 0.504886189159857 | 0.990227621680287 | 0.495113810840143 |
| 26 | 0.424631904293524 | 0.849263808587048 | 0.575368095706476 |
| 27 | 0.319185476561977 | 0.638370953123953 | 0.680814523438023 |
| 28 | 0.229808320705273 | 0.459616641410545 | 0.770191679294727 |
| 29 | 0.171568336224479 | 0.343136672448958 | 0.828431663775521 |
| 30 | 0.174025041998721 | 0.348050083997442 | 0.825974958001279 |
| 31 | 0.143465439341176 | 0.286930878682352 | 0.856534560658824 |
| 32 | 0.209432645747977 | 0.418865291495954 | 0.790567354252023 |
| 33 | 0.288031191402264 | 0.576062382804529 | 0.711968808597736 |
| 34 | 0.241567273359368 | 0.483134546718735 | 0.758432726640632 |
| 35 | 0.391748783437454 | 0.783497566874909 | 0.608251216562546 |
| 36 | 0.898694919970128 | 0.202610160059744 | 0.101305080029872 |
| 37 | 0.96780678062852 | 0.0643864387429605 | 0.0321932193714802 |
| 38 | 0.948596096135548 | 0.102807807728905 | 0.0514039038644524 |
| 39 | 0.95908270677143 | 0.0818345864571392 | 0.0409172932285696 |
| Meta Analysis of Goldfeld-Quandt test for Heteroskedasticity | |||
| Description | # significant tests | % significant tests | OK/NOK |
| 1% type I error level | 0 | 0 | OK |
| 5% type I error level | 0 | 0 | OK |
| 10% type I error level | 2 | 0.0952380952380952 | OK |