| Multiple Linear Regression - Estimated Regression Equation |
| Y[t] = -0.88950701685654 + 0.158263453991724X[t] + 0.876561943359466Y1[t] -0.0350224769283598M1[t] + 0.092789946679895M2[t] + 0.376979718036177M3[t] + 0.488008591198092M4[t] + 0.305502721955216M5[t] + 0.144327901969933M6[t] + 0.107961277896045M7[t] + 0.0473536395035613M8[t] + 0.0293919203823168M9[t] + 0.447288199200505M10[t] + 0.0349018923450704M11[t] + 0.00764007758049221t + e[t] |
| Multiple Linear Regression - Ordinary Least Squares | |||||
| Variable | Parameter | S.D. | T-STAT H0: parameter = 0 | 2-tail p-value | 1-tail p-value |
| (Intercept) | -0.88950701685654 | 0.85323 | -1.0425 | 0.302866 | 0.151433 |
| X | 0.158263453991724 | 0.087169 | 1.8156 | 0.076251 | 0.038126 |
| Y1 | 0.876561943359466 | 0.077701 | 11.2812 | 0 | 0 |
| M1 | -0.0350224769283598 | 0.190307 | -0.184 | 0.854834 | 0.427417 |
| M2 | 0.092789946679895 | 0.194913 | 0.4761 | 0.636389 | 0.318194 |
| M3 | 0.376979718036177 | 0.192001 | 1.9634 | 0.055936 | 0.027968 |
| M4 | 0.488008591198092 | 0.189646 | 2.5733 | 0.013522 | 0.006761 |
| M5 | 0.305502721955216 | 0.192867 | 1.584 | 0.120353 | 0.060177 |
| M6 | 0.144327901969933 | 0.198284 | 0.7279 | 0.470539 | 0.23527 |
| M7 | 0.107961277896045 | 0.202531 | 0.5331 | 0.596673 | 0.298337 |
| M8 | 0.0473536395035613 | 0.207577 | 0.2281 | 0.820605 | 0.410303 |
| M9 | 0.0293919203823168 | 0.201912 | 0.1456 | 0.884927 | 0.442464 |
| M10 | 0.447288199200505 | 0.188756 | 2.3697 | 0.022255 | 0.011128 |
| M11 | 0.0349018923450704 | 0.191065 | 0.1827 | 0.855896 | 0.427948 |
| t | 0.00764007758049221 | 0.00399 | 1.9149 | 0.062024 | 0.031012 |
| Multiple Linear Regression - Regression Statistics | |
| Multiple R | 0.92753981229745 |
| R-squared | 0.860330103396789 |
| Adjusted R-squared | 0.815889681750313 |
| F-TEST (value) | 19.3591795829643 |
| F-TEST (DF numerator) | 14 |
| F-TEST (DF denominator) | 44 |
| p-value | 2.48689957516035e-14 |
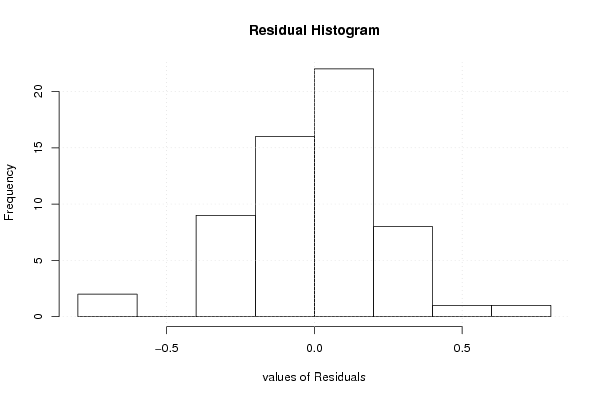
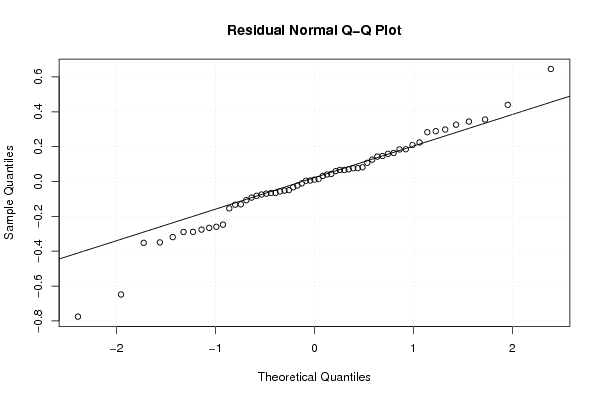
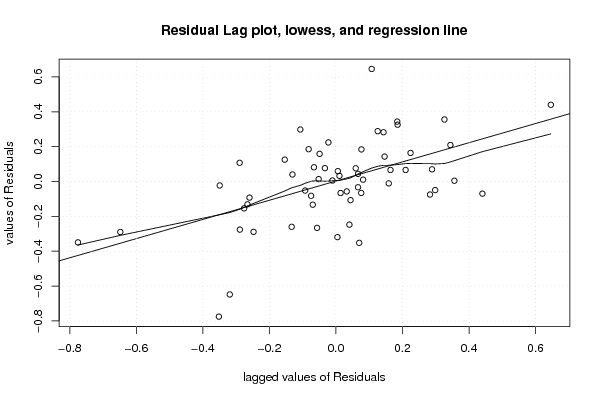
| Multiple Linear Regression - Residual Statistics | |
| Residual Standard Deviation | 0.280712364207064 |
| Sum Squared Residuals | 3.46717498242365 |
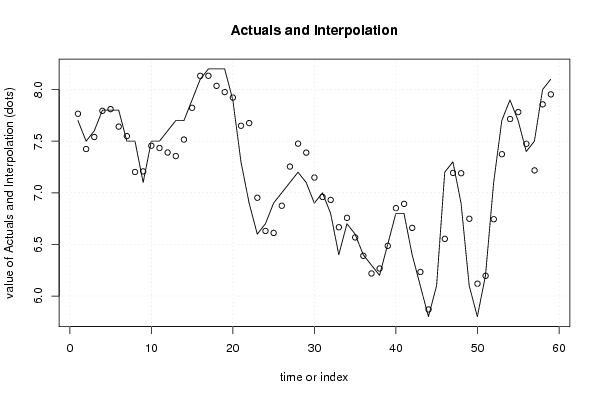
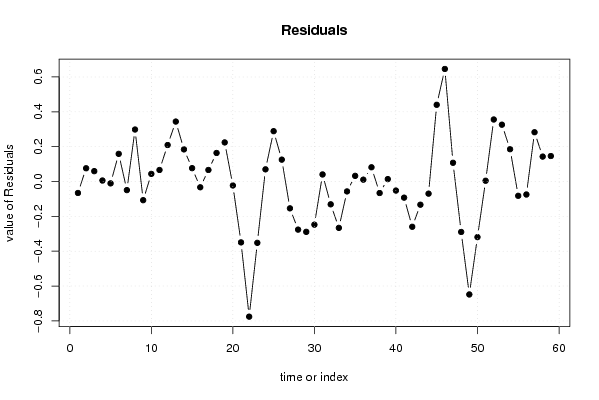
| Multiple Linear Regression - Actuals, Interpolation, and Residuals | |||
| Time or Index | Actuals | Interpolation Forecast | Residuals Prediction Error |
| 1 | 7.7 | 7.7658968649245 | -0.065896864924496 |
| 2 | 7.5 | 7.42411382557608 | 0.0758861744239167 |
| 3 | 7.6 | 7.54063128584097 | 0.0593687141590346 |
| 4 | 7.8 | 7.79443546711684 | 0.00556453288316393 |
| 5 | 7.8 | 7.81070840952552 | -0.0107084095255172 |
| 6 | 7.8 | 7.64134732172155 | 0.158652678278446 |
| 7 | 7.5 | 7.54931539363147 | -0.0493153936314696 |
| 8 | 7.5 | 7.2017265590133 | 0.298273440986706 |
| 9 | 7.1 | 7.20723126287171 | -0.107231262871714 |
| 10 | 7.5 | 7.4562326413175 | 0.0437673586824969 |
| 11 | 7.5 | 7.4337638801847 | 0.0662361198153081 |
| 12 | 7.6 | 7.39067572002094 | 0.209324279979058 |
| 13 | 7.7 | 7.35599144261399 | 0.344008557386014 |
| 14 | 7.7 | 7.51579475654199 | 0.184205243458009 |
| 15 | 7.9 | 7.82345095087794 | 0.0765490491220631 |
| 16 | 8.1 | 8.13325863569141 | -0.0332586356914102 |
| 17 | 8.2 | 8.13370523270092 | 0.0662947672990804 |
| 18 | 8.2 | 8.03617399383373 | 0.16382600616627 |
| 19 | 8.2 | 7.97579475654199 | 0.224205243458010 |
| 20 | 7.9 | 7.92282719573 | -0.0228271957299975 |
| 21 | 7.3 | 7.64953697118141 | -0.349536971181407 |
| 22 | 6.9 | 7.67574692475779 | -0.775746924757786 |
| 23 | 6.6 | 6.9520286089374 | -0.352028608937403 |
| 24 | 6.7 | 6.63014552036664 | 0.069854479633361 |
| 25 | 6.9 | 6.61128758835886 | 0.288712411641143 |
| 26 | 7 | 6.87457344202198 | 0.125426557978020 |
| 27 | 7.1 | 7.2540594852947 | -0.154059485294701 |
| 28 | 7.2 | 7.47621097577223 | -0.276210975772226 |
| 29 | 7.1 | 7.38900137844579 | -0.28900137844579 |
| 30 | 6.9 | 7.14781044170505 | -0.247810441705051 |
| 31 | 7 | 6.95959785193894 | 0.0404021480610638 |
| 32 | 6.8 | 6.9309811038662 | -0.130981103866202 |
| 33 | 6.4 | 6.6662153466577 | -0.266215346657694 |
| 34 | 6.7 | 6.75695327111176 | -0.0569532711117606 |
| 35 | 6.6 | 6.56769658864714 | 0.0323034113528587 |
| 36 | 6.4 | 6.38947319794993 | 0.0105268020500740 |
| 37 | 6.3 | 6.21843110072851 | 0.081568899271489 |
| 38 | 6.2 | 6.26622740758131 | -0.066227407581311 |
| 39 | 6.5 | 6.48622740758131 | 0.0137725924186891 |
| 40 | 6.8 | 6.85203859593239 | -0.0520385959323855 |
| 41 | 6.8 | 6.89266235108032 | -0.0926623510803243 |
| 42 | 6.4 | 6.65999588167967 | -0.259995881679671 |
| 43 | 6.1 | 6.23316552164497 | -0.133165521644974 |
| 44 | 5.8 | 5.86975034162762 | -0.0697503416276246 |
| 45 | 6.1 | 5.65976549867572 | 0.440234501324278 |
| 46 | 7.2 | 6.55401292827148 | 0.645987071728518 |
| 47 | 7.3 | 7.19261656368781 | 0.107383436312185 |
| 48 | 6.9 | 7.1897055616625 | -0.289705561662493 |
| 49 | 6.1 | 6.74839300337415 | -0.648393003374151 |
| 50 | 5.8 | 6.11929056827864 | -0.319290568278635 |
| 51 | 6.2 | 6.19563087040509 | 0.00436912959491395 |
| 52 | 7.1 | 6.74405632548714 | 0.355943674512858 |
| 53 | 7.7 | 7.37392262824745 | 0.326077371752551 |
| 54 | 7.9 | 7.71467236106 | 0.185327638940007 |
| 55 | 7.7 | 7.78212647624263 | -0.0821264762426299 |
| 56 | 7.4 | 7.47471479976288 | -0.0747147997628828 |
| 57 | 7.5 | 7.21725092061346 | 0.282749079386536 |
| 58 | 8 | 7.85705423454147 | 0.142945765458531 |
| 59 | 8.1 | 7.95389435854295 | 0.146105641457051 |
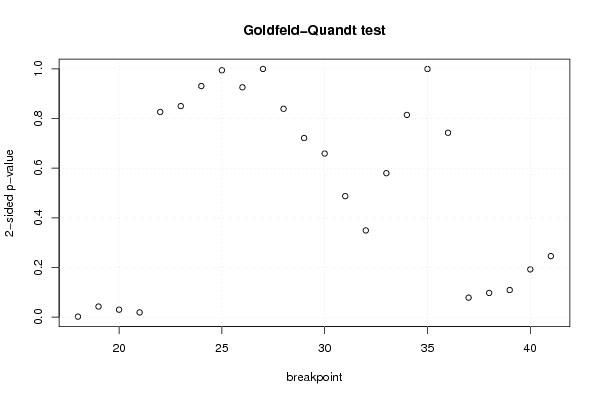
| Goldfeld-Quandt test for Heteroskedasticity | |||
| p-values | Alternative Hypothesis | ||
| breakpoint index | greater | 2-sided | less |
| 18 | 0.00096850457083687 | 0.00193700914167374 | 0.999031495429163 |
| 19 | 0.0213092970968957 | 0.0426185941937914 | 0.978690702903104 |
| 20 | 0.0150244384730460 | 0.0300488769460921 | 0.984975561526954 |
| 21 | 0.00951612242477907 | 0.0190322448495581 | 0.990483877575221 |
| 22 | 0.413075825983075 | 0.826151651966151 | 0.586924174016925 |
| 23 | 0.575070253728674 | 0.849859492542652 | 0.424929746271326 |
| 24 | 0.465251521153417 | 0.930503042306834 | 0.534748478846583 |
| 25 | 0.497002003976235 | 0.99400400795247 | 0.502997996023765 |
| 26 | 0.537226640149546 | 0.925546719700907 | 0.462773359850453 |
| 27 | 0.500286279688597 | 0.999427440622806 | 0.499713720311403 |
| 28 | 0.41946396518402 | 0.83892793036804 | 0.58053603481598 |
| 29 | 0.360578179102344 | 0.721156358204688 | 0.639421820897656 |
| 30 | 0.329389244054977 | 0.658778488109955 | 0.670610755945023 |
| 31 | 0.243585007648644 | 0.487170015297289 | 0.756414992351356 |
| 32 | 0.174556331257877 | 0.349112662515755 | 0.825443668742123 |
| 33 | 0.289804429667298 | 0.579608859334596 | 0.710195570332702 |
| 34 | 0.592892305549275 | 0.81421538890145 | 0.407107694450725 |
| 35 | 0.499586675339149 | 0.999173350678298 | 0.500413324660851 |
| 36 | 0.628821205906724 | 0.742357588186551 | 0.371178794093276 |
| 37 | 0.960800537911328 | 0.0783989241773443 | 0.0391994620886722 |
| 38 | 0.95126972266719 | 0.097460554665621 | 0.0487302773328105 |
| 39 | 0.945462279498959 | 0.109075441002083 | 0.0545377205010413 |
| 40 | 0.903836442381478 | 0.192327115237044 | 0.0961635576185218 |
| 41 | 0.877139935456774 | 0.245720129086452 | 0.122860064543226 |
| Meta Analysis of Goldfeld-Quandt test for Heteroskedasticity | |||
| Description | # significant tests | % significant tests | OK/NOK |
| 1% type I error level | 1 | 0.0416666666666667 | NOK |
| 5% type I error level | 4 | 0.166666666666667 | NOK |
| 10% type I error level | 6 | 0.25 | NOK |