| Multiple Linear Regression - Estimated Regression Equation |
| Y[t] = + 0.0591462227848196 + 0.0660454365791428X[t] + 1.52512703254502`Y-1`[t] -0.620545370718424`Y-2`[t] -0.441317537172667`Y-3`[t] + 0.498373687006295`Y-4`[t] + 0.162625204980074`Y-5`[t] -0.231593669035930`Y-6`[t] + 0.111512253826071M1[t] + 0.193313373161585M2[t] -0.0219414502710726M3[t] -0.0762588111162378M4[t] + 0.453205779017736M5[t] -0.292372779576293M6[t] -0.0892150900311018M7[t] + 0.181115372158409M8[t] + 0.0796701373967479M9[t] + 0.213160532284749M10[t] + 0.225129629065532M11[t] + 0.00219583945301820t + e[t] |
| Multiple Linear Regression - Ordinary Least Squares | |||||
| Variable | Parameter | S.D. | T-STAT H0: parameter = 0 | 2-tail p-value | 1-tail p-value |
| (Intercept) | 0.0591462227848196 | 0.786612 | 0.0752 | 0.940503 | 0.470252 |
| X | 0.0660454365791428 | 0.077628 | 0.8508 | 0.400835 | 0.200417 |
| `Y-1` | 1.52512703254502 | 0.170155 | 8.9632 | 0 | 0 |
| `Y-2` | -0.620545370718424 | 0.313336 | -1.9804 | 0.055792 | 0.027896 |
| `Y-3` | -0.441317537172667 | 0.337024 | -1.3095 | 0.199161 | 0.09958 |
| `Y-4` | 0.498373687006295 | 0.342229 | 1.4563 | 0.154495 | 0.077248 |
| `Y-5` | 0.162625204980074 | 0.333675 | 0.4874 | 0.62912 | 0.31456 |
| `Y-6` | -0.231593669035930 | 0.201016 | -1.1521 | 0.257311 | 0.128655 |
| M1 | 0.111512253826071 | 0.153467 | 0.7266 | 0.472432 | 0.236216 |
| M2 | 0.193313373161585 | 0.163651 | 1.1813 | 0.245699 | 0.12285 |
| M3 | -0.0219414502710726 | 0.163436 | -0.1343 | 0.893996 | 0.446998 |
| M4 | -0.0762588111162378 | 0.165896 | -0.4597 | 0.648673 | 0.324337 |
| M5 | 0.453205779017736 | 0.167597 | 2.7041 | 0.010618 | 0.005309 |
| M6 | -0.292372779576293 | 0.169298 | -1.727 | 0.09325 | 0.046625 |
| M7 | -0.0892150900311018 | 0.181994 | -0.4902 | 0.627135 | 0.313568 |
| M8 | 0.181115372158409 | 0.204158 | 0.8871 | 0.381239 | 0.19062 |
| M9 | 0.0796701373967479 | 0.194521 | 0.4096 | 0.68469 | 0.342345 |
| M10 | 0.213160532284749 | 0.170468 | 1.2504 | 0.219675 | 0.109838 |
| M11 | 0.225129629065532 | 0.157307 | 1.4311 | 0.161517 | 0.080759 |
| t | 0.00219583945301820 | 0.00389 | 0.5645 | 0.57611 | 0.288055 |
| Multiple Linear Regression - Regression Statistics | |
| Multiple R | 0.966793725165996 |
| R-squared | 0.934690107020344 |
| Adjusted R-squared | 0.898193402119949 |
| F-TEST (value) | 25.6102601473540 |
| F-TEST (DF numerator) | 19 |
| F-TEST (DF denominator) | 34 |
| p-value | 7.7715611723761e-15 |
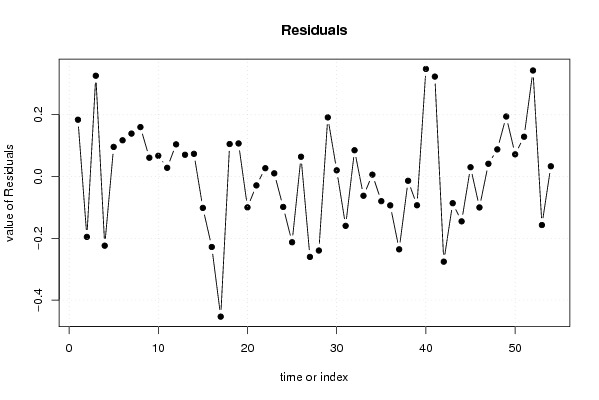
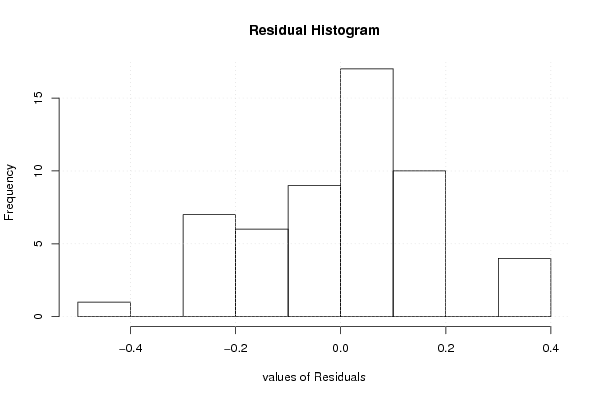
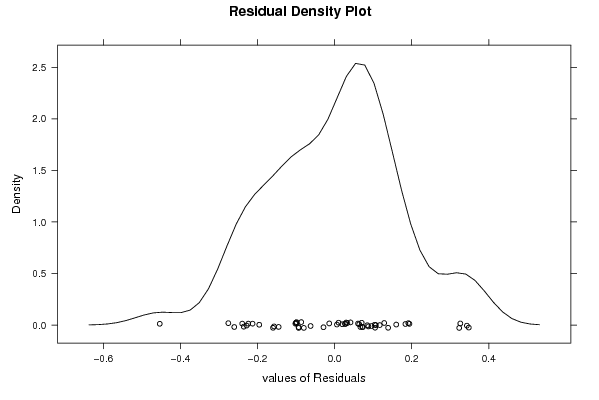
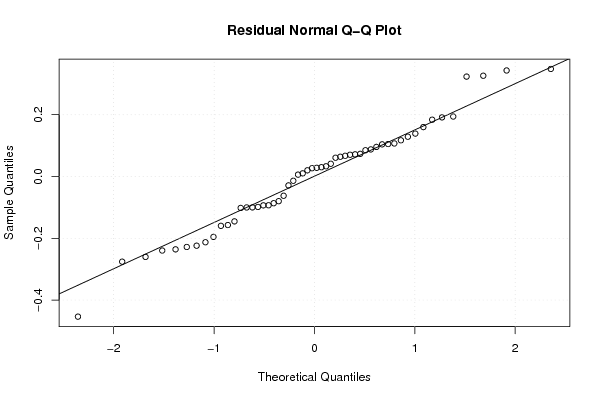
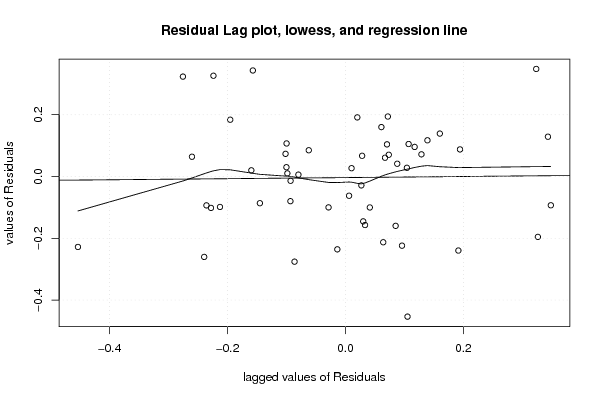
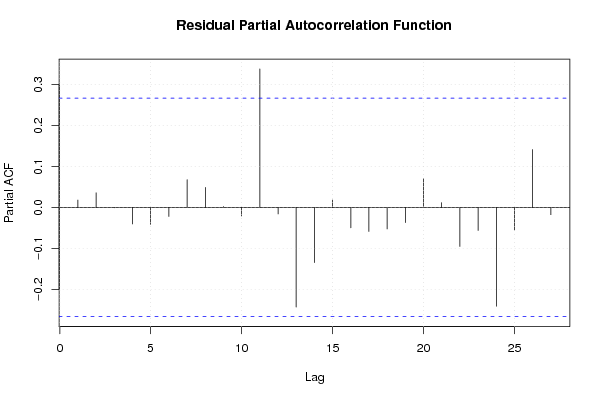
| Multiple Linear Regression - Residual Statistics | |
| Residual Standard Deviation | 0.211400014540384 |
| Sum Squared Residuals | 1.51945884902094 |
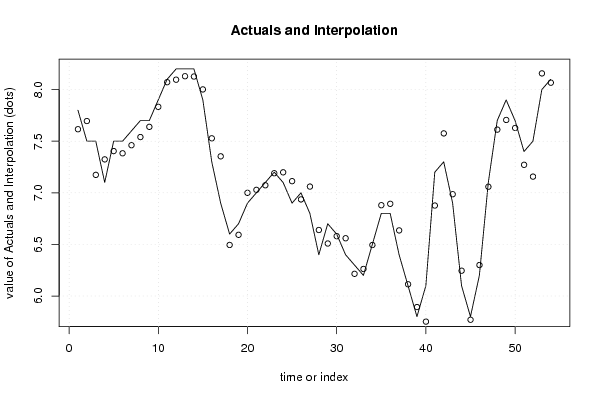
| Multiple Linear Regression - Actuals, Interpolation, and Residuals | |||
| Time or Index | Actuals | Interpolation Forecast | Residuals Prediction Error |
| 1 | 7.8 | 7.61611765500372 | 0.183882344996277 |
| 2 | 7.5 | 7.69538272704505 | -0.195382727045054 |
| 3 | 7.5 | 7.17383253769253 | 0.32616746230747 |
| 4 | 7.1 | 7.32384484526625 | -0.223844845266247 |
| 5 | 7.5 | 7.4041809694169 | 0.0958190305830996 |
| 6 | 7.5 | 7.38276419279521 | 0.117235807204791 |
| 7 | 7.6 | 7.46103448322318 | 0.138965516776820 |
| 8 | 7.7 | 7.54004783721192 | 0.159952162788082 |
| 9 | 7.7 | 7.63913782626477 | 0.0608621737352328 |
| 10 | 7.9 | 7.832929863081 | 0.0670701369190068 |
| 11 | 8.1 | 8.0717928968507 | 0.0282071031492954 |
| 12 | 8.2 | 8.09587532880215 | 0.104124671197852 |
| 13 | 8.2 | 8.1296176100361 | 0.0703823899638934 |
| 14 | 8.2 | 8.1266028075001 | 0.073397192499899 |
| 15 | 7.9 | 8.00161184820047 | -0.101611848200468 |
| 16 | 7.3 | 7.52799589293427 | -0.227995892934273 |
| 17 | 6.9 | 7.35352385016391 | -0.453523850163913 |
| 18 | 6.6 | 6.49486252199998 | 0.105137478000016 |
| 19 | 6.7 | 6.59296541840794 | 0.107034581592062 |
| 20 | 6.9 | 6.9998605574022 | -0.0998605574021935 |
| 21 | 7 | 7.02871716462899 | -0.0287171646289862 |
| 22 | 7.1 | 7.0730692876912 | 0.0269307123088047 |
| 23 | 7.2 | 7.18972070115202 | 0.0102792988479844 |
| 24 | 7.1 | 7.19852868261494 | -0.098528682614943 |
| 25 | 6.9 | 7.11274082464347 | -0.212740824643470 |
| 26 | 7 | 6.93602085932694 | 0.0639791406730605 |
| 27 | 6.8 | 7.06023775412614 | -0.260237754126141 |
| 28 | 6.4 | 6.63954286319189 | -0.239542863191892 |
| 29 | 6.7 | 6.50863771904235 | 0.191362280957651 |
| 30 | 6.6 | 6.57993282902121 | 0.0200671709787864 |
| 31 | 6.4 | 6.55962540069074 | -0.159625400690735 |
| 32 | 6.3 | 6.21496077635801 | 0.0850392236419927 |
| 33 | 6.2 | 6.26222026357286 | -0.0622202635728567 |
| 34 | 6.5 | 6.49390404323143 | 0.00609595676857139 |
| 35 | 6.8 | 6.87977347774989 | -0.0797734777498863 |
| 36 | 6.8 | 6.89332926663582 | -0.0933292666358247 |
| 37 | 6.4 | 6.63567461386656 | -0.235674613866564 |
| 38 | 6.1 | 6.11382082001902 | -0.0138208200190193 |
| 39 | 5.8 | 5.893087278089 | -0.0930872780890019 |
| 40 | 6.1 | 5.75184590843284 | 0.348154091567157 |
| 41 | 7.2 | 6.87663481219026 | 0.323365187809742 |
| 42 | 7.3 | 7.5755840089807 | -0.2755840089807 |
| 43 | 6.9 | 6.98637469767815 | -0.0863746976781471 |
| 44 | 6.1 | 6.24513082902788 | -0.145130829027881 |
| 45 | 5.8 | 5.76992474553339 | 0.0300752544666105 |
| 46 | 6.2 | 6.30009680599638 | -0.100096805996383 |
| 47 | 7.1 | 7.0587129242474 | 0.0412870757526068 |
| 48 | 7.7 | 7.61226672194709 | 0.0877332780529151 |
| 49 | 7.9 | 7.70584929645014 | 0.194150703549864 |
| 50 | 7.7 | 7.62817278610889 | 0.0718272138911134 |
| 51 | 7.4 | 7.27123058189186 | 0.128769418108140 |
| 52 | 7.5 | 7.15677049017474 | 0.343229509825256 |
| 53 | 8 | 8.15702264918658 | -0.15702264918658 |
| 54 | 8.1 | 8.0668564472029 | 0.0331435527971063 |
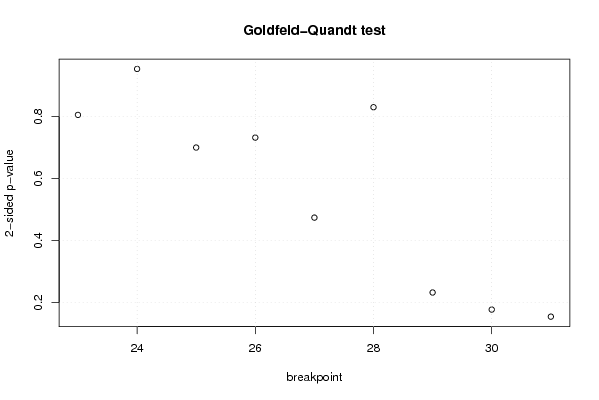
| Goldfeld-Quandt test for Heteroskedasticity | |||
| p-values | Alternative Hypothesis | ||
| breakpoint index | greater | 2-sided | less |
| 23 | 0.597193244950406 | 0.805613510099189 | 0.402806755049594 |
| 24 | 0.476981287181768 | 0.953962574363536 | 0.523018712818232 |
| 25 | 0.350147394197845 | 0.700294788395689 | 0.649852605802155 |
| 26 | 0.366210128277344 | 0.732420256554688 | 0.633789871722656 |
| 27 | 0.237093948121046 | 0.474187896242091 | 0.762906051878954 |
| 28 | 0.415235068579751 | 0.830470137159503 | 0.584764931420249 |
| 29 | 0.883742024685328 | 0.232515950629344 | 0.116257975314672 |
| 30 | 0.91128209278357 | 0.177435814432859 | 0.0887179072164294 |
| 31 | 0.92270232914616 | 0.154595341707680 | 0.0772976708538401 |
| Meta Analysis of Goldfeld-Quandt test for Heteroskedasticity | |||
| Description | # significant tests | % significant tests | OK/NOK |
| 1% type I error level | 0 | 0 | OK |
| 5% type I error level | 0 | 0 | OK |
| 10% type I error level | 0 | 0 | OK |