| Multiple Linear Regression - Estimated Regression Equation |
| Y[t] = -0.206618878764414 + 0.0835818229950486X[t] + 1.52890254510051`Y-1`[t] -0.711924325810514`Y-2`[t] -0.264801000441926`Y-3`[t] + 0.461488266484942`Y-4`[t] + 0.266355376773095M1[t] + 0.155434228591892M2[t] -0.0233346187909136M3[t] + 0.0582735063385753M4[t] + 0.113138663587701M5[t] -0.0762817036946616M6[t] -0.117538108379314M7[t] + 0.410083083239657M8[t] -0.348315498829714M9[t] -0.068081760433958M10[t] + 0.0996209060985931M11[t] + 0.00138288697974347t + e[t] |
| Multiple Linear Regression - Ordinary Least Squares | |||||
| Variable | Parameter | S.D. | T-STAT H0: parameter = 0 | 2-tail p-value | 1-tail p-value |
| (Intercept) | -0.206618878764414 | 0.544443 | -0.3795 | 0.706371 | 0.353186 |
| X | 0.0835818229950486 | 0.105695 | 0.7908 | 0.433855 | 0.216927 |
| `Y-1` | 1.52890254510051 | 0.145638 | 10.498 | 0 | 0 |
| `Y-2` | -0.711924325810514 | 0.278027 | -2.5606 | 0.014433 | 0.007217 |
| `Y-3` | -0.264801000441926 | 0.277183 | -0.9553 | 0.345296 | 0.172648 |
| `Y-4` | 0.461488266484942 | 0.153193 | 3.0125 | 0.004534 | 0.002267 |
| M1 | 0.266355376773095 | 0.138643 | 1.9212 | 0.062042 | 0.031021 |
| M2 | 0.155434228591892 | 0.146075 | 1.0641 | 0.293841 | 0.14692 |
| M3 | -0.0233346187909136 | 0.148041 | -0.1576 | 0.875568 | 0.437784 |
| M4 | 0.0582735063385753 | 0.146148 | 0.3987 | 0.692267 | 0.346133 |
| M5 | 0.113138663587701 | 0.145224 | 0.7791 | 0.440643 | 0.220322 |
| M6 | -0.0762817036946616 | 0.141797 | -0.538 | 0.593658 | 0.296829 |
| M7 | -0.117538108379314 | 0.140423 | -0.837 | 0.407677 | 0.203839 |
| M8 | 0.410083083239657 | 0.139288 | 2.9441 | 0.005433 | 0.002717 |
| M9 | -0.348315498829714 | 0.159101 | -2.1893 | 0.034626 | 0.017313 |
| M10 | -0.068081760433958 | 0.16833 | -0.4045 | 0.688088 | 0.344044 |
| M11 | 0.0996209060985931 | 0.157438 | 0.6328 | 0.530581 | 0.26529 |
| t | 0.00138288697974347 | 0.003385 | 0.4085 | 0.685157 | 0.342579 |
| Multiple Linear Regression - Regression Statistics | |
| Multiple R | 0.966437910189696 |
| R-squared | 0.934002234251826 |
| Adjusted R-squared | 0.905233977387238 |
| F-TEST (value) | 32.4664173657845 |
| F-TEST (DF numerator) | 17 |
| F-TEST (DF denominator) | 39 |
| p-value | 0 |
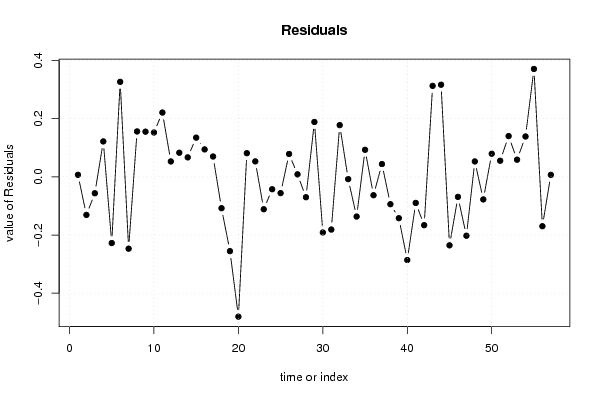
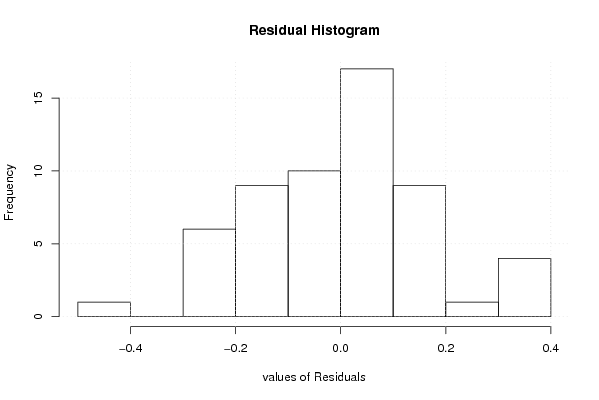
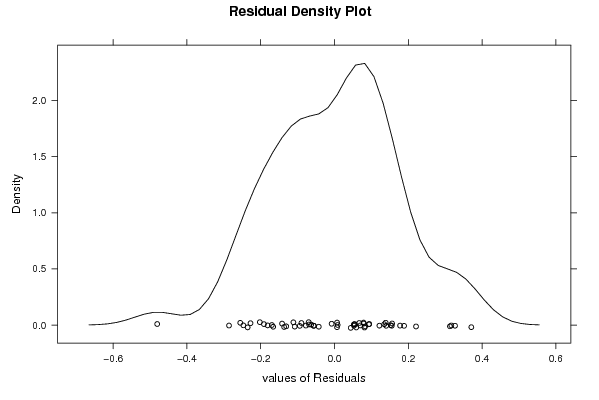
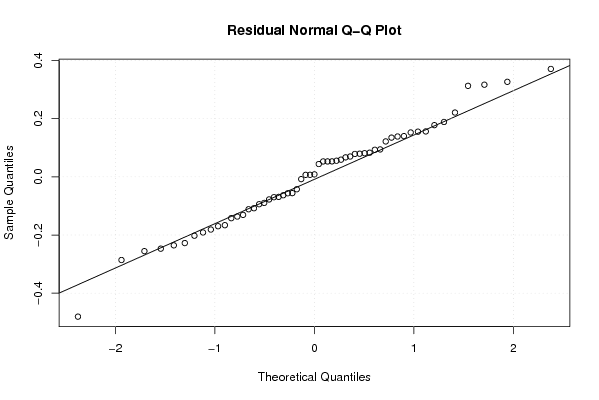
| Multiple Linear Regression - Residual Statistics | |
| Residual Standard Deviation | 0.203197265081223 |
| Sum Squared Residuals | 1.61027601292307 |
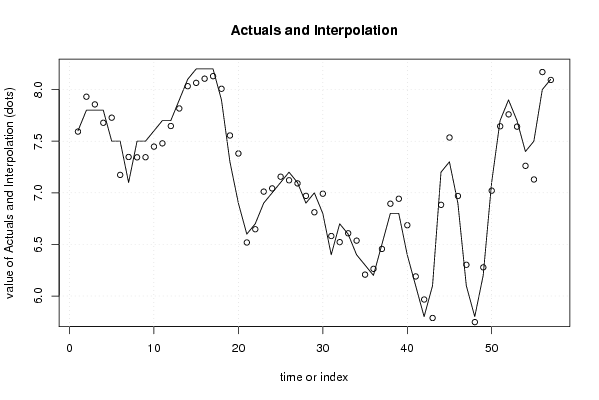
| Multiple Linear Regression - Actuals, Interpolation, and Residuals | |||
| Time or Index | Actuals | Interpolation Forecast | Residuals Prediction Error |
| 1 | 7.6 | 7.5930891928012 | 0.00691080719879664 |
| 2 | 7.8 | 7.93089527809715 | -0.130895278097154 |
| 3 | 7.8 | 7.85646228762755 | -0.0564622876275469 |
| 4 | 7.8 | 7.6782906812335 | 0.121709318766505 |
| 5 | 7.5 | 7.72772735202247 | -0.227727352022473 |
| 6 | 7.5 | 7.1733167614867 | 0.326683238513308 |
| 7 | 7.1 | 7.34702054152494 | -0.247020541524937 |
| 8 | 7.5 | 7.34390390221603 | 0.156096097783973 |
| 9 | 7.5 | 7.34477247554533 | 0.155227524454675 |
| 10 | 7.6 | 7.44753977077339 | 0.152460229226610 |
| 11 | 7.7 | 7.47899987202499 | 0.221000127975014 |
| 12 | 7.7 | 7.64705498142911 | 0.0529450185708865 |
| 13 | 7.9 | 7.8171207125567 | 0.082879287443293 |
| 14 | 8.1 | 8.03303168697965 | 0.0669683130203491 |
| 15 | 8.2 | 8.06519019708308 | 0.134809802916919 |
| 16 | 8.2 | 8.10572639845187 | 0.0942736015481242 |
| 17 | 8.2 | 8.1301194633083 | 0.0698805366917033 |
| 18 | 7.9 | 8.00789953625847 | -0.107899536258473 |
| 19 | 7.3 | 7.5555040816719 | -0.255504081671909 |
| 20 | 6.9 | 7.38074393095347 | -0.480743930953472 |
| 21 | 6.6 | 6.51876211344253 | 0.0812378865574694 |
| 22 | 6.7 | 6.64691182593176 | 0.0530881740682446 |
| 23 | 6.9 | 7.01149237198306 | -0.111492371983060 |
| 24 | 7 | 7.04268742284186 | -0.0426874228418621 |
| 25 | 7.1 | 7.15600449595297 | -0.0560044959529722 |
| 26 | 7.2 | 7.12135268324062 | 0.0786473167593798 |
| 27 | 7.1 | 7.09148209801935 | 0.00851790198064515 |
| 28 | 6.9 | 6.97005914964179 | -0.0700591496417848 |
| 29 | 7 | 6.81138784403591 | 0.188612155964093 |
| 30 | 6.8 | 6.99125441009813 | -0.191254410098128 |
| 31 | 6.4 | 6.58121932423196 | -0.181219324231957 |
| 32 | 6.7 | 6.52226949661139 | 0.177730503388607 |
| 33 | 6.6 | 6.607803322113 | -0.00780332211300146 |
| 34 | 6.4 | 6.53657514211508 | -0.136575142115077 |
| 35 | 6.3 | 6.20703701246177 | 0.0929629875382312 |
| 36 | 6.2 | 6.26322018398464 | -0.0632201839846451 |
| 37 | 6.5 | 6.45607199924838 | 0.043928000751624 |
| 38 | 6.8 | 6.89416120390037 | -0.0941612039003712 |
| 39 | 6.8 | 6.94219998268 | -0.142199982680004 |
| 40 | 6.4 | 6.68602457026501 | -0.286024570265010 |
| 41 | 6.1 | 6.18971777626658 | -0.0897177762665835 |
| 42 | 5.8 | 5.9662257427035 | -0.166225742703500 |
| 43 | 6.1 | 5.78717915938836 | 0.312820840611635 |
| 44 | 7.2 | 6.88327629279899 | 0.316723707201015 |
| 45 | 7.3 | 7.53546991976386 | -0.235469919763855 |
| 46 | 6.9 | 6.96897326117978 | -0.0689732611797782 |
| 47 | 6.1 | 6.30247074353018 | -0.202470743530185 |
| 48 | 5.8 | 5.74703741174438 | 0.0529625882556206 |
| 49 | 6.2 | 6.27771359944074 | -0.0777135994407418 |
| 50 | 7.1 | 7.0205591477822 | 0.0794408522177961 |
| 51 | 7.7 | 7.64466543459001 | 0.055334565409987 |
| 52 | 7.9 | 7.75989920040783 | 0.140100799592166 |
| 53 | 7.7 | 7.64104756436674 | 0.0589524356332608 |
| 54 | 7.4 | 7.26130354945321 | 0.138696450546792 |
| 55 | 7.5 | 7.12907689318283 | 0.370923106817168 |
| 56 | 8 | 8.16980637742012 | -0.169806377420123 |
| 57 | 8.1 | 8.09319216913529 | 0.00680783086471272 |
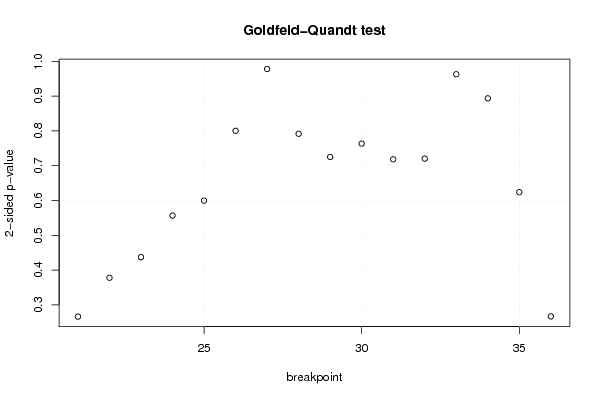
| Goldfeld-Quandt test for Heteroskedasticity | |||
| p-values | Alternative Hypothesis | ||
| breakpoint index | greater | 2-sided | less |
| 21 | 0.86693160958983 | 0.266136780820341 | 0.133068390410171 |
| 22 | 0.811053117439573 | 0.377893765120854 | 0.188946882560427 |
| 23 | 0.781410494290239 | 0.437179011419522 | 0.218589505709761 |
| 24 | 0.72163067546098 | 0.55673864907804 | 0.27836932453902 |
| 25 | 0.700202775376297 | 0.599594449247406 | 0.299797224623703 |
| 26 | 0.599821421726036 | 0.800357156547929 | 0.400178578273964 |
| 27 | 0.489102143983505 | 0.97820428796701 | 0.510897856016495 |
| 28 | 0.395925698110509 | 0.791851396221017 | 0.604074301889491 |
| 29 | 0.63738544711802 | 0.72522910576396 | 0.36261455288198 |
| 30 | 0.618318511897711 | 0.763362976204577 | 0.381681488102289 |
| 31 | 0.640785667418245 | 0.71842866516351 | 0.359214332581755 |
| 32 | 0.639794659482982 | 0.720410681034037 | 0.360205340517018 |
| 33 | 0.518483824278609 | 0.963032351442783 | 0.481516175721391 |
| 34 | 0.446854921165211 | 0.893709842330422 | 0.553145078834789 |
| 35 | 0.68799860863488 | 0.624002782730239 | 0.312001391365119 |
| 36 | 0.866583284751526 | 0.266833430496947 | 0.133416715248474 |
| Meta Analysis of Goldfeld-Quandt test for Heteroskedasticity | |||
| Description | # significant tests | % significant tests | OK/NOK |
| 1% type I error level | 0 | 0 | OK |
| 5% type I error level | 0 | 0 | OK |
| 10% type I error level | 0 | 0 | OK |