| Multiple Linear Regression - Estimated Regression Equation |
| yt[t] = -36966.1549603009 + 0.22521259944289xt[t] + 0.78008644395922`yt-1`[t] + 0.264724289662743`yt-2`[t] -0.254204822249017`yt-3`[t] -0.203055482260318`yt-4`[t] -347.98479049917M1[t] + 6078.80639576497M2[t] + 23777.7731454625M3[t] -879.960276448189M4[t] -26288.3288224235M5[t] -13027.8366627345M6[t] + 837.100853143718M7[t] + 10420.6488383957M8[t] + 2634.58407307717M9[t] -3258.91930047984M10[t] -2450.69027059630M11[t] -133.111522809557t + e[t] |
| Multiple Linear Regression - Ordinary Least Squares | |||||
| Variable | Parameter | S.D. | T-STAT H0: parameter = 0 | 2-tail p-value | 1-tail p-value |
| (Intercept) | -36966.1549603009 | 22937.83424 | -1.6116 | 0.113749 | 0.056875 |
| xt | 0.22521259944289 | 0.090142 | 2.4984 | 0.01603 | 0.008015 |
| `yt-1` | 0.78008644395922 | 0.165544 | 4.7123 | 2.2e-05 | 1.1e-05 |
| `yt-2` | 0.264724289662743 | 0.194979 | 1.3577 | 0.181041 | 0.09052 |
| `yt-3` | -0.254204822249017 | 0.193207 | -1.3157 | 0.194652 | 0.097326 |
| `yt-4` | -0.203055482260318 | 0.148286 | -1.3693 | 0.177398 | 0.088699 |
| M1 | -347.98479049917 | 2866.797343 | -0.1214 | 0.903904 | 0.451952 |
| M2 | 6078.80639576497 | 2785.121722 | 2.1826 | 0.034096 | 0.017048 |
| M3 | 23777.7731454625 | 5409.373049 | 4.3957 | 6.3e-05 | 3.1e-05 |
| M4 | -879.960276448189 | 6192.846762 | -0.1421 | 0.887614 | 0.443807 |
| M5 | -26288.3288224235 | 5194.015973 | -5.0613 | 7e-06 | 3e-06 |
| M6 | -13027.8366627345 | 6464.106182 | -2.0154 | 0.0496 | 0.0248 |
| M7 | 837.100853143718 | 3603.229911 | 0.2323 | 0.817298 | 0.408649 |
| M8 | 10420.6488383957 | 3475.914187 | 2.998 | 0.004333 | 0.002167 |
| M9 | 2634.58407307717 | 3462.062074 | 0.761 | 0.450466 | 0.225233 |
| M10 | -3258.91930047984 | 3240.768223 | -1.0056 | 0.319757 | 0.159878 |
| M11 | -2450.69027059630 | 2985.771893 | -0.8208 | 0.41591 | 0.207955 |
| t | -133.111522809557 | 57.949216 | -2.297 | 0.026118 | 0.013059 |
| Multiple Linear Regression - Regression Statistics | |
| Multiple R | 0.991167080004474 |
| R-squared | 0.982412180484596 |
| Adjusted R-squared | 0.976050628744981 |
| F-TEST (value) | 154.429645579548 |
| F-TEST (DF numerator) | 17 |
| F-TEST (DF denominator) | 47 |
| p-value | 0 |
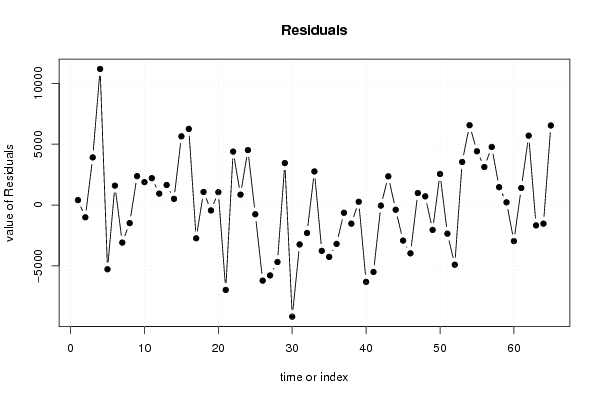
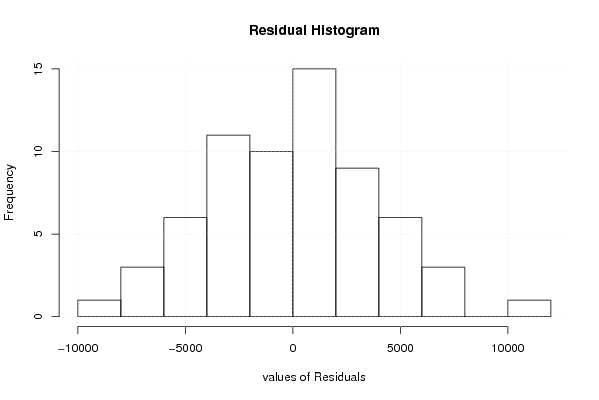
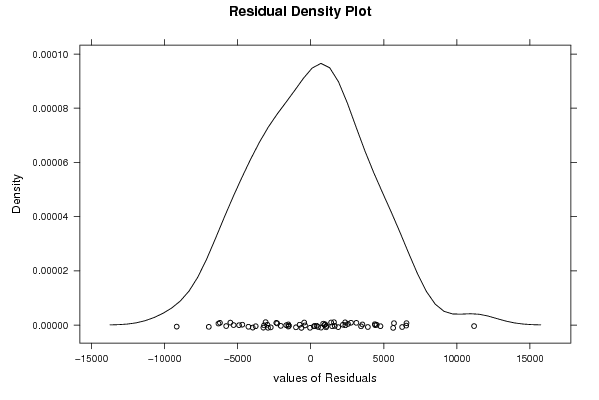
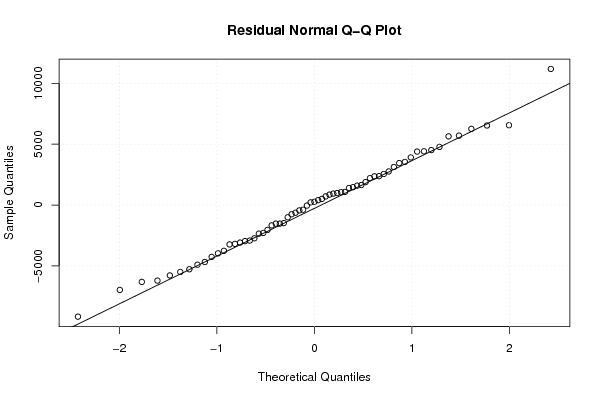
| Multiple Linear Regression - Residual Statistics | |
| Residual Standard Deviation | 4551.16421878486 |
| Sum Squared Residuals | 973515500.07834 |
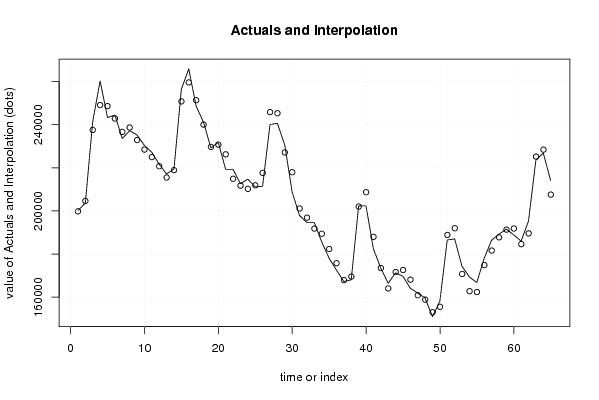
| Multiple Linear Regression - Actuals, Interpolation, and Residuals | |||
| Time or Index | Actuals | Interpolation Forecast | Residuals Prediction Error |
| 1 | 200237 | 199836.660039697 | 400.339960302505 |
| 2 | 203666 | 204675.073366061 | -1009.07336606120 |
| 3 | 241476 | 237565.161501211 | 3910.83849878931 |
| 4 | 260307 | 249126.785995017 | 11180.2140049834 |
| 5 | 243324 | 248602.549394501 | -5278.54939450088 |
| 6 | 244460 | 242868.684433672 | 1591.31556632780 |
| 7 | 233575 | 236662.444655061 | -3087.44465506060 |
| 8 | 237217 | 238705.638293358 | -1488.63829335779 |
| 9 | 235243 | 232872.226899459 | 2370.77310054110 |
| 10 | 230354 | 228471.529765229 | 1882.47023477076 |
| 11 | 227184 | 224979.656281923 | 2204.34371807677 |
| 12 | 221678 | 220741.187876437 | 936.81212356349 |
| 13 | 217142 | 215498.298591159 | 1643.70140884093 |
| 14 | 219452 | 218948.535951556 | 503.464048444141 |
| 15 | 256446 | 250804.006995541 | 5641.99300445873 |
| 16 | 265845 | 259589.547099676 | 6255.4529003237 |
| 17 | 248624 | 251360.317802748 | -2736.31780274849 |
| 18 | 241114 | 240039.560988423 | 1074.43901157729 |
| 19 | 229245 | 229689.036985530 | -444.036985529751 |
| 20 | 231805 | 230752.885080671 | 1052.11491932911 |
| 21 | 219277 | 226253.895536446 | -6976.89553644604 |
| 22 | 219313 | 214922.846327002 | 4390.15367299793 |
| 23 | 212610 | 211755.273185077 | 854.726814922845 |
| 24 | 214771 | 210258.479270699 | 4512.52072930115 |
| 25 | 211142 | 211901.376540130 | -759.376540129599 |
| 26 | 211457 | 217670.427118698 | -6213.42711869812 |
| 27 | 240048 | 245833.606853983 | -5785.60685398271 |
| 28 | 240636 | 245319.085028244 | -4683.08502824393 |
| 29 | 230580 | 227134.663931852 | 3445.33606814812 |
| 30 | 208795 | 217968.880572155 | -9173.88057215511 |
| 31 | 197922 | 201161.096884328 | -3239.09688432764 |
| 32 | 194596 | 196892.421568183 | -2296.42156818325 |
| 33 | 194581 | 191823.760551609 | 2757.23944839119 |
| 34 | 185686 | 189452.561993850 | -3766.56199384959 |
| 35 | 178106 | 182368.769543950 | -4262.76954394974 |
| 36 | 172608 | 175801.872799113 | -3193.87279911266 |
| 37 | 167302 | 167938.060135102 | -636.060135101805 |
| 38 | 168053 | 169582.966918991 | -1529.96691899087 |
| 39 | 202300 | 202036.373041012 | 263.626958988097 |
| 40 | 202388 | 208703.653392679 | -6315.65339267872 |
| 41 | 182516 | 188018.312490783 | -5502.31249078323 |
| 42 | 173476 | 173523.687647982 | -47.6876479823754 |
| 43 | 166444 | 164087.458165350 | 2356.54183464975 |
| 44 | 171297 | 171686.546509356 | -389.54650935584 |
| 45 | 169701 | 172624.685030377 | -2923.68503037744 |
| 46 | 164182 | 168152.733873489 | -3970.73387348871 |
| 47 | 161914 | 160929.833455853 | 984.166544147243 |
| 48 | 159612 | 158901.664660917 | 710.335339083216 |
| 49 | 151001 | 153047.657276374 | -2046.65727637441 |
| 50 | 158114 | 155563.740204767 | 2550.25979523312 |
| 51 | 186530 | 188885.093622934 | -2355.09362293394 |
| 52 | 187069 | 191974.143242376 | -4905.14324237641 |
| 53 | 174330 | 170792.435920744 | 3537.56407925560 |
| 54 | 169362 | 162806.186357768 | 6555.81364223239 |
| 55 | 166827 | 162412.963309732 | 4414.03669026824 |
| 56 | 178037 | 174914.508548432 | 3122.49145156777 |
| 57 | 186412 | 181639.431982109 | 4772.56801789119 |
| 58 | 189226 | 187761.328040430 | 1464.67195956961 |
| 59 | 191563 | 191343.467533197 | 219.532466802877 |
| 60 | 188906 | 191871.795392835 | -2965.79539283518 |
| 61 | 186005 | 184606.947417538 | 1398.05258246237 |
| 62 | 195309 | 189610.256439927 | 5698.74356007292 |
| 63 | 223532 | 225207.757985319 | -1675.75798531948 |
| 64 | 226899 | 228430.785242008 | -1531.78524200806 |
| 65 | 214126 | 207591.720459371 | 6534.27954062887 |
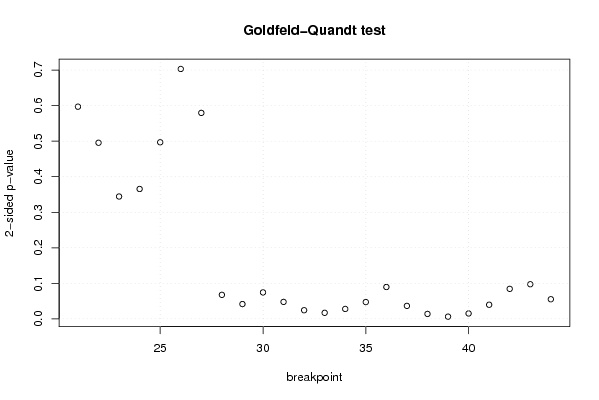
| Goldfeld-Quandt test for Heteroskedasticity | |||
| p-values | Alternative Hypothesis | ||
| breakpoint index | greater | 2-sided | less |
| 21 | 0.29853286404638 | 0.59706572809276 | 0.70146713595362 |
| 22 | 0.247783725264127 | 0.495567450528253 | 0.752216274735873 |
| 23 | 0.172149322133961 | 0.344298644267922 | 0.827850677866039 |
| 24 | 0.817262937336885 | 0.365474125326231 | 0.182737062663115 |
| 25 | 0.751549066285133 | 0.496901867429733 | 0.248450933714867 |
| 26 | 0.648369200790014 | 0.703261598419972 | 0.351630799209986 |
| 27 | 0.71018323221065 | 0.579633535578701 | 0.289816767789351 |
| 28 | 0.966200897002074 | 0.0675982059958511 | 0.0337991029979256 |
| 29 | 0.97918786842403 | 0.0416242631519391 | 0.0208121315759695 |
| 30 | 0.962789086859814 | 0.0744218262803726 | 0.0372109131401863 |
| 31 | 0.97614484143197 | 0.0477103171360581 | 0.0238551585680290 |
| 32 | 0.987862045034491 | 0.0242759099310172 | 0.0121379549655086 |
| 33 | 0.991493182240934 | 0.0170136355181316 | 0.00850681775906582 |
| 34 | 0.986047630552244 | 0.0279047388955117 | 0.0139523694477558 |
| 35 | 0.976385401547123 | 0.0472291969057548 | 0.0236145984528774 |
| 36 | 0.955203432925047 | 0.0895931341499057 | 0.0447965670749528 |
| 37 | 0.981753983601425 | 0.0364920327971499 | 0.0182460163985749 |
| 38 | 0.99304304634829 | 0.0139139073034196 | 0.00695695365170981 |
| 39 | 0.996901988089753 | 0.00619602382049388 | 0.00309801191024694 |
| 40 | 0.992430623197616 | 0.0151387536047672 | 0.00756937680238358 |
| 41 | 0.98015860699283 | 0.0396827860143406 | 0.0198413930071703 |
| 42 | 0.95778545435407 | 0.0844290912918588 | 0.0422145456459294 |
| 43 | 0.951291811910326 | 0.0974163761793488 | 0.0487081880896744 |
| 44 | 0.972403867737687 | 0.0551922645246269 | 0.0275961322623135 |
| Meta Analysis of Goldfeld-Quandt test for Heteroskedasticity | |||
| Description | # significant tests | % significant tests | OK/NOK |
| 1% type I error level | 1 | 0.0416666666666667 | NOK |
| 5% type I error level | 11 | 0.458333333333333 | NOK |
| 10% type I error level | 17 | 0.708333333333333 | NOK |