| Multiple Linear Regression - Estimated Regression Equation |
| Y[t] = + 3.14254545454545 -1.92272727272727X[t] -0.0985454545454535M1[t] + 0.178000000000001M2[t] + 0.0820000000000008M3[t] + 0.00200000000000018M4[t] -0.103999999999999M5[t] -0.0739999999999996M6[t] -0.0859999999999994M7[t] -0.111999999999999M8[t] -0.0719999999999994M9[t] -0.0599999999999995M10[t] -0.0119999999999993M11[t] + e[t] |
| Multiple Linear Regression - Ordinary Least Squares | |||||
| Variable | Parameter | S.D. | T-STAT H0: parameter = 0 | 2-tail p-value | 1-tail p-value |
| (Intercept) | 3.14254545454545 | 0.432843 | 7.2602 | 0 | 0 |
| X | -1.92272727272727 | 0.322622 | -5.9597 | 0 | 0 |
| M1 | -0.0985454545454535 | 0.608722 | -0.1619 | 0.872087 | 0.436044 |
| M2 | 0.178000000000001 | 0.605293 | 0.2941 | 0.769997 | 0.384999 |
| M3 | 0.0820000000000008 | 0.605293 | 0.1355 | 0.892817 | 0.446409 |
| M4 | 0.00200000000000018 | 0.605293 | 0.0033 | 0.997378 | 0.498689 |
| M5 | -0.103999999999999 | 0.605293 | -0.1718 | 0.864318 | 0.432159 |
| M6 | -0.0739999999999996 | 0.605293 | -0.1223 | 0.903218 | 0.451609 |
| M7 | -0.0859999999999994 | 0.605293 | -0.1421 | 0.887624 | 0.443812 |
| M8 | -0.111999999999999 | 0.605293 | -0.185 | 0.853998 | 0.426999 |
| M9 | -0.0719999999999994 | 0.605293 | -0.119 | 0.905821 | 0.452911 |
| M10 | -0.0599999999999995 | 0.605293 | -0.0991 | 0.92146 | 0.46073 |
| M11 | -0.0119999999999993 | 0.605293 | -0.0198 | 0.984267 | 0.492133 |
| Multiple Linear Regression - Regression Statistics | |
| Multiple R | 0.660747900887518 |
| R-squared | 0.436587788527261 |
| Adjusted R-squared | 0.292737862193795 |
| F-TEST (value) | 3.03502267714191 |
| F-TEST (DF numerator) | 12 |
| F-TEST (DF denominator) | 47 |
| p-value | 0.00316967686042147 |
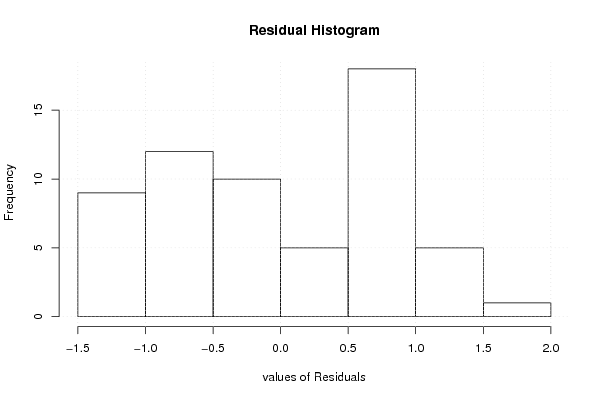
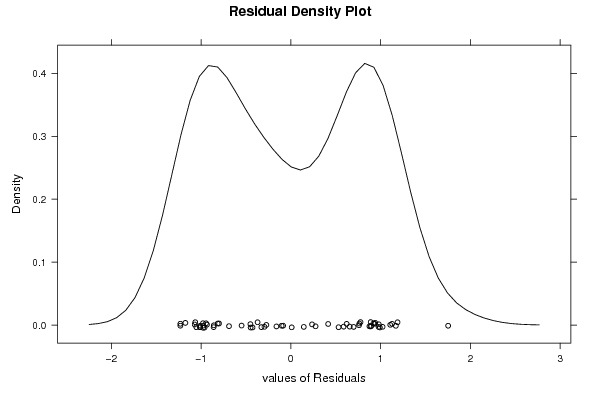
| Multiple Linear Regression - Residual Statistics | |
| Residual Standard Deviation | 0.957051484257931 |
| Sum Squared Residuals | 43.0495345454545 |
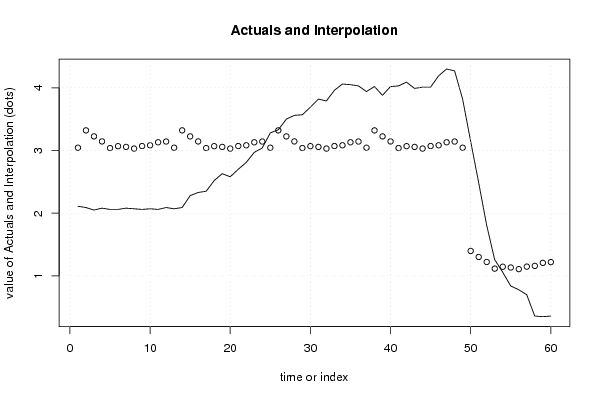
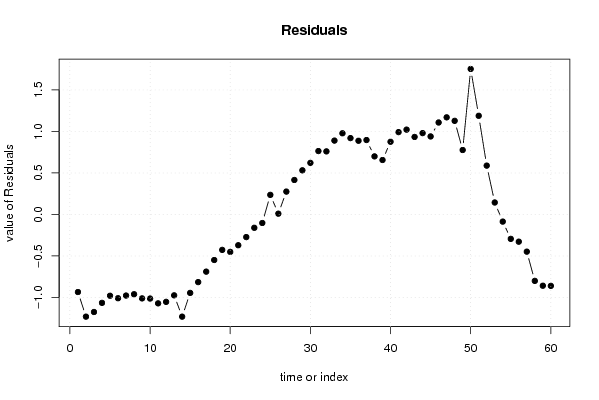
| Multiple Linear Regression - Actuals, Interpolation, and Residuals | |||
| Time or Index | Actuals | Interpolation Forecast | Residuals Prediction Error |
| 1 | 2.11 | 3.04400000000000 | -0.933999999999997 |
| 2 | 2.09 | 3.32054545454545 | -1.23054545454545 |
| 3 | 2.05 | 3.22454545454545 | -1.17454545454545 |
| 4 | 2.08 | 3.14454545454545 | -1.06454545454545 |
| 5 | 2.06 | 3.03854545454545 | -0.978545454545454 |
| 6 | 2.06 | 3.06854545454545 | -1.00854545454545 |
| 7 | 2.08 | 3.05654545454545 | -0.976545454545455 |
| 8 | 2.07 | 3.03054545454545 | -0.960545454545454 |
| 9 | 2.06 | 3.07054545454545 | -1.01054545454545 |
| 10 | 2.07 | 3.08254545454545 | -1.01254545454545 |
| 11 | 2.06 | 3.13054545454545 | -1.07054545454545 |
| 12 | 2.09 | 3.14254545454545 | -1.05254545454545 |
| 13 | 2.07 | 3.044 | -0.974 |
| 14 | 2.09 | 3.32054545454545 | -1.23054545454545 |
| 15 | 2.28 | 3.22454545454545 | -0.944545454545455 |
| 16 | 2.33 | 3.14454545454545 | -0.814545454545454 |
| 17 | 2.35 | 3.03854545454545 | -0.688545454545454 |
| 18 | 2.52 | 3.06854545454545 | -0.548545454545455 |
| 19 | 2.63 | 3.05654545454545 | -0.426545454545455 |
| 20 | 2.58 | 3.03054545454545 | -0.450545454545454 |
| 21 | 2.7 | 3.07054545454545 | -0.370545454545454 |
| 22 | 2.81 | 3.08254545454545 | -0.272545454545454 |
| 23 | 2.97 | 3.13054545454545 | -0.160545454545454 |
| 24 | 3.04 | 3.14254545454545 | -0.102545454545454 |
| 25 | 3.28 | 3.044 | 0.235999999999999 |
| 26 | 3.33 | 3.32054545454546 | 0.00945454545454505 |
| 27 | 3.5 | 3.22454545454545 | 0.275454545454545 |
| 28 | 3.56 | 3.14454545454545 | 0.415454545454546 |
| 29 | 3.57 | 3.03854545454545 | 0.531454545454545 |
| 30 | 3.69 | 3.06854545454545 | 0.621454545454545 |
| 31 | 3.82 | 3.05654545454545 | 0.763454545454545 |
| 32 | 3.79 | 3.03054545454545 | 0.759454545454545 |
| 33 | 3.96 | 3.07054545454545 | 0.889454545454545 |
| 34 | 4.06 | 3.08254545454545 | 0.977454545454545 |
| 35 | 4.05 | 3.13054545454545 | 0.919454545454545 |
| 36 | 4.03 | 3.14254545454545 | 0.887454545454546 |
| 37 | 3.94 | 3.044 | 0.896 |
| 38 | 4.02 | 3.32054545454546 | 0.699454545454544 |
| 39 | 3.88 | 3.22454545454545 | 0.655454545454545 |
| 40 | 4.02 | 3.14454545454545 | 0.875454545454545 |
| 41 | 4.03 | 3.03854545454545 | 0.991454545454546 |
| 42 | 4.09 | 3.06854545454545 | 1.02145454545455 |
| 43 | 3.99 | 3.05654545454545 | 0.933454545454546 |
| 44 | 4.01 | 3.03054545454545 | 0.979454545454545 |
| 45 | 4.01 | 3.07054545454545 | 0.939454545454545 |
| 46 | 4.19 | 3.08254545454545 | 1.10745454545455 |
| 47 | 4.3 | 3.13054545454545 | 1.16945454545455 |
| 48 | 4.27 | 3.14254545454545 | 1.12745454545455 |
| 49 | 3.82 | 3.044 | 0.776 |
| 50 | 3.15 | 1.39781818181818 | 1.75218181818182 |
| 51 | 2.49 | 1.30181818181818 | 1.18818181818182 |
| 52 | 1.81 | 1.22181818181818 | 0.588181818181819 |
| 53 | 1.26 | 1.11581818181818 | 0.144181818181818 |
| 54 | 1.06 | 1.14581818181818 | -0.0858181818181818 |
| 55 | 0.84 | 1.13381818181818 | -0.293818181818182 |
| 56 | 0.78 | 1.10781818181818 | -0.327818181818182 |
| 57 | 0.7 | 1.14781818181818 | -0.447818181818182 |
| 58 | 0.36 | 1.15981818181818 | -0.799818181818182 |
| 59 | 0.35 | 1.20781818181818 | -0.857818181818182 |
| 60 | 0.36 | 1.21981818181818 | -0.859818181818181 |
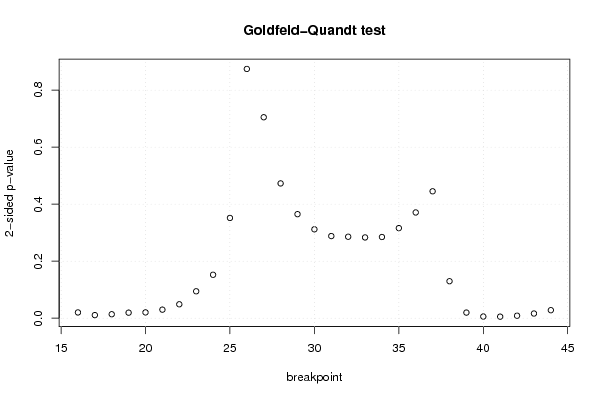
| Goldfeld-Quandt test for Heteroskedasticity | |||
| p-values | Alternative Hypothesis | ||
| breakpoint index | greater | 2-sided | less |
| 16 | 0.0101414379855108 | 0.0202828759710217 | 0.98985856201449 |
| 17 | 0.00545416239386613 | 0.0109083247877323 | 0.994545837606134 |
| 18 | 0.00698023616235786 | 0.0139604723247157 | 0.993019763837642 |
| 19 | 0.00972780541962902 | 0.0194556108392580 | 0.99027219458037 |
| 20 | 0.0102272433629200 | 0.0204544867258401 | 0.98977275663708 |
| 21 | 0.015033188301581 | 0.030066376603162 | 0.98496681169842 |
| 22 | 0.0244432946978093 | 0.0488865893956186 | 0.97555670530219 |
| 23 | 0.0472280181431450 | 0.0944560362862901 | 0.952771981856855 |
| 24 | 0.0762011134247896 | 0.152402226849579 | 0.92379888657521 |
| 25 | 0.175830786767908 | 0.351661573535815 | 0.824169213232092 |
| 26 | 0.437178900903216 | 0.874357801806432 | 0.562821099096784 |
| 27 | 0.647540469937673 | 0.704919060124655 | 0.352459530062327 |
| 28 | 0.763559657477072 | 0.472880685045857 | 0.236440342522928 |
| 29 | 0.81749728800422 | 0.365005423991561 | 0.182502711995780 |
| 30 | 0.84406717602024 | 0.31186564795952 | 0.15593282397976 |
| 31 | 0.855922624473336 | 0.288154751053327 | 0.144077375526664 |
| 32 | 0.857125352777552 | 0.285749294444897 | 0.142874647222448 |
| 33 | 0.858322048706325 | 0.283355902587350 | 0.141677951293675 |
| 34 | 0.85755183575583 | 0.284896328488339 | 0.142448164244169 |
| 35 | 0.84197650685106 | 0.316046986297881 | 0.158023493148940 |
| 36 | 0.81451407490792 | 0.370971850184161 | 0.185485925092080 |
| 37 | 0.777403429217733 | 0.445193141564534 | 0.222596570782267 |
| 38 | 0.935094832249302 | 0.129810335501397 | 0.0649051677506984 |
| 39 | 0.990132954922947 | 0.0197340901541051 | 0.00986704507705255 |
| 40 | 0.997055717447443 | 0.00588856510511477 | 0.00294428255255739 |
| 41 | 0.997251622734194 | 0.00549675453161283 | 0.00274837726580642 |
| 42 | 0.995612171744347 | 0.00877565651130582 | 0.00438782825565291 |
| 43 | 0.99175244547098 | 0.0164951090580394 | 0.00824755452901972 |
| 44 | 0.98592053094421 | 0.0281589381115786 | 0.0140794690557893 |
| Meta Analysis of Goldfeld-Quandt test for Heteroskedasticity | |||
| Description | # significant tests | % significant tests | OK/NOK |
| 1% type I error level | 3 | 0.103448275862069 | NOK |
| 5% type I error level | 13 | 0.448275862068966 | NOK |
| 10% type I error level | 14 | 0.482758620689655 | NOK |