| Multiple Linear Regression - Estimated Regression Equation |
| Omzet[t] = + 24.2719954836995 -3.31703241456063Uitvoer[t] + 0.347127616231981`Omzet-1`[t] + 0.355694576847724`Omzet-2`[t] + 0.307636566464671`Omzet-3`[t] -0.236660071043794`Omzet-4`[t] -4.91920455650283M1[t] + 6.34477868482915M2[t] -25.1185619148915M3[t] -26.1790950346311M4[t] + 8.80183878654852M5[t] + 22.3700847428009M6[t] -1.49099973052366M7[t] -27.9110842666772M8[t] -9.46201939302143M9[t] -1.42678907684248M10[t] + 20.2095761552773M11[t] + 0.356533729590830t + e[t] |
| Multiple Linear Regression - Ordinary Least Squares | |||||
| Variable | Parameter | S.D. | T-STAT H0: parameter = 0 | 2-tail p-value | 1-tail p-value |
| (Intercept) | 24.2719954836995 | 12.683334 | 1.9137 | 0.063214 | 0.031607 |
| Uitvoer | -3.31703241456063 | 4.600685 | -0.721 | 0.47533 | 0.237665 |
| `Omzet-1` | 0.347127616231981 | 0.160029 | 2.1691 | 0.036395 | 0.018197 |
| `Omzet-2` | 0.355694576847724 | 0.155791 | 2.2831 | 0.028103 | 0.014052 |
| `Omzet-3` | 0.307636566464671 | 0.152078 | 2.0229 | 0.050162 | 0.025081 |
| `Omzet-4` | -0.236660071043794 | 0.148675 | -1.5918 | 0.119716 | 0.059858 |
| M1 | -4.91920455650283 | 7.632115 | -0.6445 | 0.523097 | 0.261549 |
| M2 | 6.34477868482915 | 7.917077 | 0.8014 | 0.427881 | 0.21394 |
| M3 | -25.1185619148915 | 7.618837 | -3.2969 | 0.002126 | 0.001063 |
| M4 | -26.1790950346311 | 10.452156 | -2.5047 | 0.016665 | 0.008332 |
| M5 | 8.80183878654852 | 10.674972 | 0.8245 | 0.414784 | 0.207392 |
| M6 | 22.3700847428009 | 8.973643 | 2.4929 | 0.017146 | 0.008573 |
| M7 | -1.49099973052366 | 7.400757 | -0.2015 | 0.841409 | 0.420704 |
| M8 | -27.9110842666772 | 8.188848 | -3.4084 | 0.001559 | 0.00078 |
| M9 | -9.46201939302143 | 9.497802 | -0.9962 | 0.325439 | 0.162719 |
| M10 | -1.42678907684248 | 8.915995 | -0.16 | 0.873708 | 0.436854 |
| M11 | 20.2095761552773 | 8.231792 | 2.4551 | 0.018775 | 0.009388 |
| t | 0.356533729590830 | 0.18995 | 1.877 | 0.068213 | 0.034107 |
| Multiple Linear Regression - Regression Statistics | |
| Multiple R | 0.951390734495854 |
| R-squared | 0.90514432968456 |
| Adjusted R-squared | 0.862708898227653 |
| F-TEST (value) | 21.3299193294106 |
| F-TEST (DF numerator) | 17 |
| F-TEST (DF denominator) | 38 |
| p-value | 2.20934381900406e-14 |
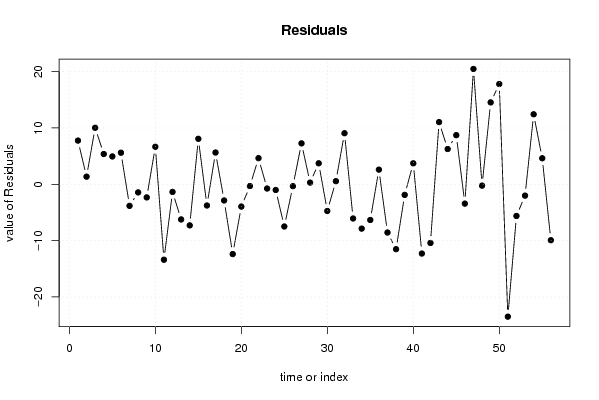
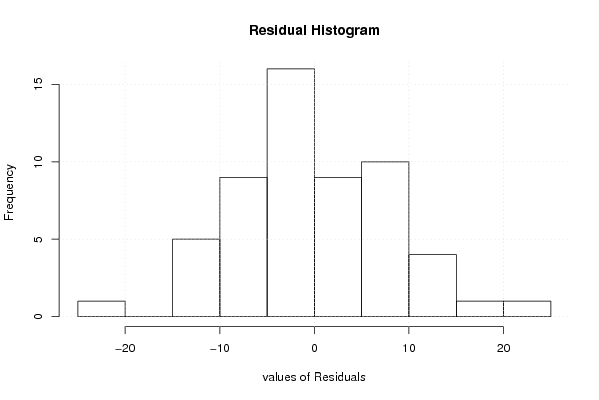
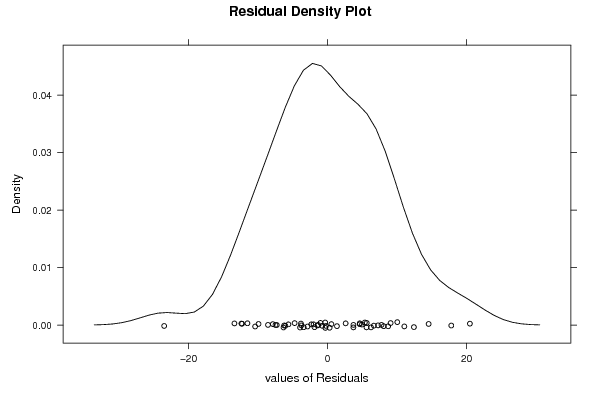
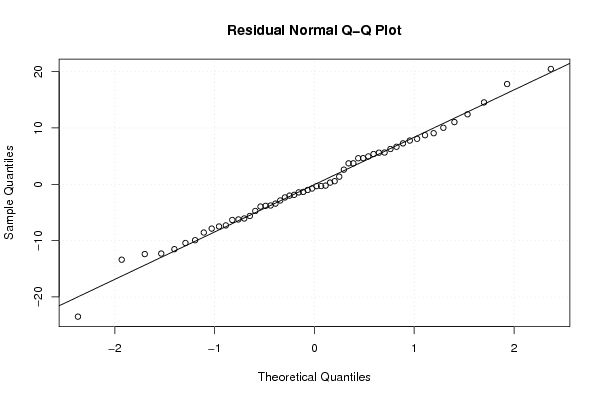
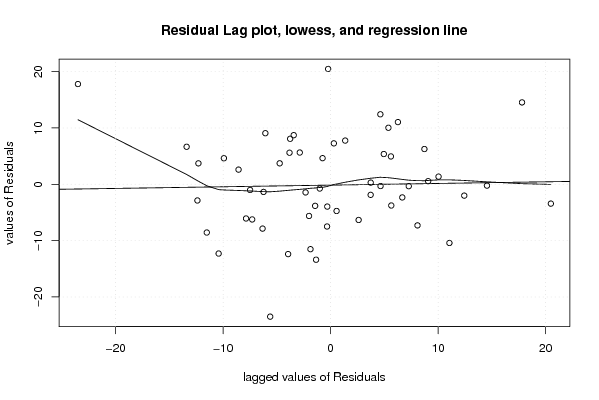
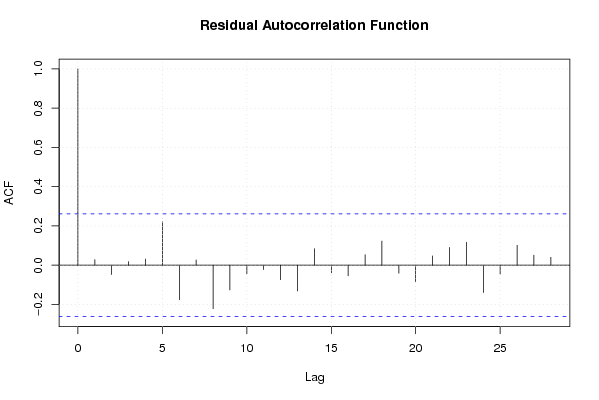
| Multiple Linear Regression - Residual Statistics | |
| Residual Standard Deviation | 10.0190822837749 |
| Sum Squared Residuals | 3814.516372744 |
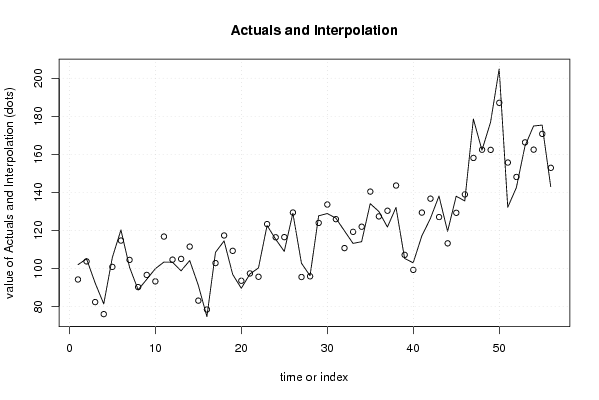
| Multiple Linear Regression - Actuals, Interpolation, and Residuals | |||
| Time or Index | Actuals | Interpolation Forecast | Residuals Prediction Error |
| 1 | 102 | 94.2404032330187 | 7.75959676698129 |
| 2 | 105.1 | 103.746100264482 | 1.35389973551846 |
| 3 | 92.4 | 82.365986416481 | 10.034013583519 |
| 4 | 81.4 | 76.0274016100569 | 5.37259838994313 |
| 5 | 105.8 | 100.855113254624 | 4.9448867453756 |
| 6 | 120.3 | 114.696535816866 | 5.60346418313407 |
| 7 | 100.7 | 104.525863854725 | -3.82586385472518 |
| 8 | 88.8 | 90.2428085520879 | -1.44280855208789 |
| 9 | 94.3 | 96.6321992962278 | -2.33219929622776 |
| 10 | 99.9 | 93.239152033943 | 6.66084796605706 |
| 11 | 103.4 | 116.792915656183 | -13.3929156561833 |
| 12 | 103.3 | 104.654965478633 | -1.35496547863286 |
| 13 | 98.8 | 105.040679705087 | -6.24067970508657 |
| 14 | 104.2 | 111.497952115501 | -7.29795211550119 |
| 15 | 91.2 | 83.1229672864702 | 8.07703271352985 |
| 16 | 74.7 | 78.4663610582967 | -3.76636105829667 |
| 17 | 108.5 | 102.861368806265 | 5.63863119373523 |
| 18 | 114.5 | 117.372861655084 | -2.87286165508431 |
| 19 | 96.9 | 109.291163297658 | -12.3911632976583 |
| 20 | 89.6 | 93.5553410252276 | -3.95534102522758 |
| 21 | 97.1 | 97.4133924749686 | -0.313392474968604 |
| 22 | 100.3 | 95.6606468208883 | 4.63935317911174 |
| 23 | 122.6 | 123.351533796078 | -0.751533796077798 |
| 24 | 115.4 | 116.412552625382 | -1.01255262538195 |
| 25 | 109 | 116.492038505162 | -7.49203850516242 |
| 26 | 129.1 | 129.432920983719 | -0.332920983718978 |
| 27 | 102.8 | 95.5344310452043 | 7.26556895479571 |
| 28 | 96.2 | 95.9025472434957 | 0.297452756504345 |
| 29 | 127.7 | 123.975292182100 | 3.7247078179005 |
| 30 | 128.9 | 133.639298446054 | -4.73929844605406 |
| 31 | 126.5 | 125.949438542287 | 0.55056145771306 |
| 32 | 119.8 | 110.732123261511 | 9.06787673848912 |
| 33 | 113.2 | 119.272671493447 | -6.0726714934468 |
| 34 | 114.1 | 121.967919762438 | -7.867919762438 |
| 35 | 134.1 | 140.432468546754 | -6.33246854675421 |
| 36 | 130 | 127.397324702197 | 2.60267529780310 |
| 37 | 121.8 | 130.364151564395 | -8.56415156439549 |
| 38 | 132.1 | 143.619611582494 | -11.5196115824944 |
| 39 | 105.3 | 107.177012286022 | -1.87701228602162 |
| 40 | 103 | 99.2813333686565 | 3.71866663134348 |
| 41 | 117.1 | 129.397061959720 | -12.2970619597197 |
| 42 | 126.3 | 136.715984794680 | -10.4159847946798 |
| 43 | 138.1 | 127.055227454938 | 11.0447725450619 |
| 44 | 119.5 | 113.242166377464 | 6.25783362253559 |
| 45 | 138 | 129.281736735357 | 8.71826326464317 |
| 46 | 135.5 | 138.932281382731 | -3.43228138273081 |
| 47 | 178.6 | 158.123082000985 | 20.4769179990153 |
| 48 | 162.2 | 162.435157193788 | -0.235157193788282 |
| 49 | 176.9 | 162.362726992337 | 14.5372730076632 |
| 50 | 204.9 | 187.103415053804 | 17.7965849461961 |
| 51 | 132.2 | 155.699602965823 | -23.4996029658230 |
| 52 | 142.5 | 148.122356719494 | -5.62235671949428 |
| 53 | 164.3 | 166.311163797292 | -2.01116379729165 |
| 54 | 174.9 | 162.475319287316 | 12.4246807126842 |
| 55 | 175.4 | 170.778306850391 | 4.62169314960861 |
| 56 | 143 | 152.927560783709 | -9.92756078370925 |
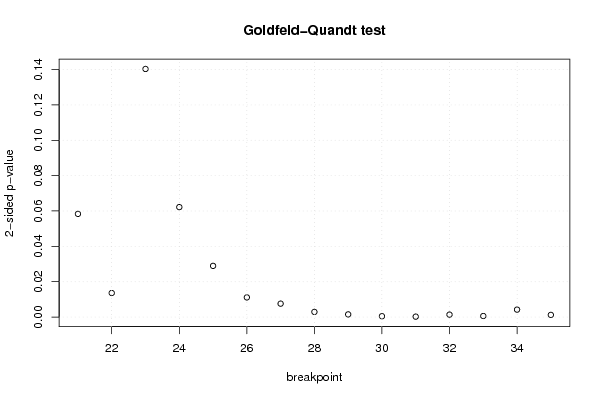
| Goldfeld-Quandt test for Heteroskedasticity | |||
| p-values | Alternative Hypothesis | ||
| breakpoint index | greater | 2-sided | less |
| 21 | 0.0291724116304499 | 0.0583448232608997 | 0.97082758836955 |
| 22 | 0.00680679627949363 | 0.0136135925589873 | 0.993193203720506 |
| 23 | 0.0701598337130306 | 0.140319667426061 | 0.929840166286969 |
| 24 | 0.0310909516865713 | 0.0621819033731427 | 0.968909048313429 |
| 25 | 0.0144778157974757 | 0.0289556315949514 | 0.985522184202524 |
| 26 | 0.00556785999809254 | 0.0111357199961851 | 0.994432140001907 |
| 27 | 0.00380019470168722 | 0.00760038940337443 | 0.996199805298313 |
| 28 | 0.00146813923991246 | 0.00293627847982491 | 0.998531860760087 |
| 29 | 0.000765481099785137 | 0.00153096219957027 | 0.999234518900215 |
| 30 | 0.00024668860453997 | 0.00049337720907994 | 0.99975331139546 |
| 31 | 0.000124909326817666 | 0.000249818653635333 | 0.999875090673182 |
| 32 | 0.000693347882583993 | 0.00138669576516799 | 0.999306652117416 |
| 33 | 0.000303866748665010 | 0.000607733497330021 | 0.999696133251335 |
| 34 | 0.00211640876208985 | 0.0042328175241797 | 0.99788359123791 |
| 35 | 0.000620810807895228 | 0.00124162161579046 | 0.999379189192105 |
| Meta Analysis of Goldfeld-Quandt test for Heteroskedasticity | |||
| Description | # significant tests | % significant tests | OK/NOK |
| 1% type I error level | 9 | 0.6 | NOK |
| 5% type I error level | 12 | 0.8 | NOK |
| 10% type I error level | 14 | 0.933333333333333 | NOK |