| Multiple Linear Regression - Estimated Regression Equation |
| Omzet[t] = + 26.1376860921832 -1.44041616513782Uitvoer[t] + 0.314190804274826`Omzet-1`[t] + 0.361312695475143`Omzet-2`[t] + 14.8923044799708M1[t] + 5.18880377075971M2[t] -0.977242744491664M3[t] + 13.8940093239983M4[t] -21.3068427437488M5[t] -22.6258863164955M6[t] + 15.4496362100097M7[t] + 17.2466376332173M8[t] -0.68198202941588M9[t] -18.1300566873355M10[t] -3.72729217804567M11[t] + 0.496577843788959t + e[t] |
| Multiple Linear Regression - Ordinary Least Squares | |||||
| Variable | Parameter | S.D. | T-STAT H0: parameter = 0 | 2-tail p-value | 1-tail p-value |
| (Intercept) | 26.1376860921832 | 10.977887 | 2.3809 | 0.02188 | 0.01094 |
| Uitvoer | -1.44041616513782 | 4.689712 | -0.3071 | 0.760252 | 0.380126 |
| `Omzet-1` | 0.314190804274826 | 0.142918 | 2.1984 | 0.033483 | 0.016742 |
| `Omzet-2` | 0.361312695475143 | 0.14196 | 2.5452 | 0.014684 | 0.007342 |
| M1 | 14.8923044799708 | 7.321697 | 2.034 | 0.0483 | 0.02415 |
| M2 | 5.18880377075971 | 7.73936 | 0.6704 | 0.506245 | 0.253123 |
| M3 | -0.977242744491664 | 7.768238 | -0.1258 | 0.900491 | 0.450245 |
| M4 | 13.8940093239983 | 7.670138 | 1.8114 | 0.077228 | 0.038614 |
| M5 | -21.3068427437488 | 7.796212 | -2.733 | 0.009145 | 0.004572 |
| M6 | -22.6258863164955 | 8.935556 | -2.5321 | 0.015165 | 0.007583 |
| M7 | 15.4496362100097 | 7.462869 | 2.0702 | 0.044619 | 0.022309 |
| M8 | 17.2466376332173 | 7.696342 | 2.2409 | 0.030378 | 0.015189 |
| M9 | -0.68198202941588 | 7.547821 | -0.0904 | 0.928435 | 0.464217 |
| M10 | -18.1300566873355 | 7.774407 | -2.332 | 0.024569 | 0.012284 |
| M11 | -3.72729217804567 | 8.020094 | -0.4647 | 0.644515 | 0.322258 |
| t | 0.496577843788959 | 0.184256 | 2.695 | 0.010077 | 0.005039 |
| Multiple Linear Regression - Regression Statistics | |
| Multiple R | 0.93939025754965 |
| R-squared | 0.8824540559792 |
| Adjusted R-squared | 0.840473361686056 |
| F-TEST (value) | 21.0204731207443 |
| F-TEST (DF numerator) | 15 |
| F-TEST (DF denominator) | 42 |
| p-value | 8.21565038222616e-15 |
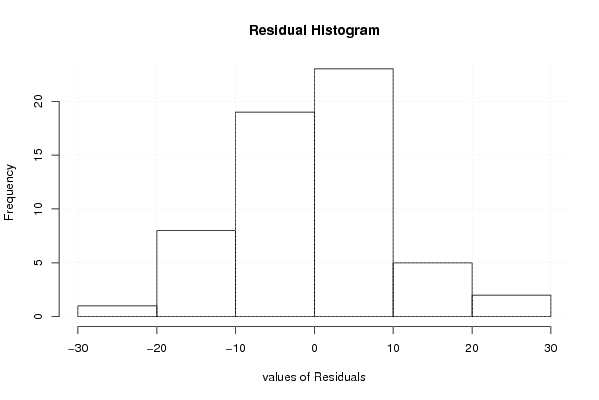
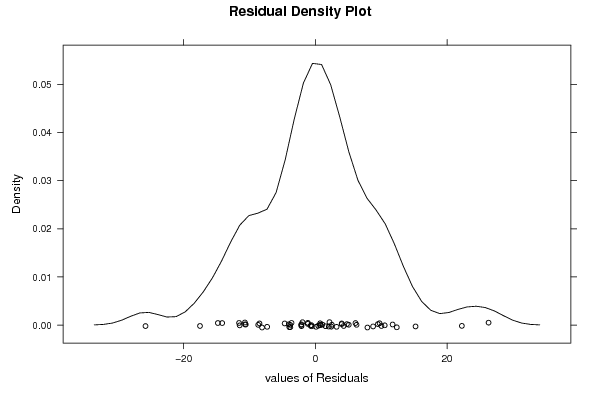
| Multiple Linear Regression - Residual Statistics | |
| Residual Standard Deviation | 10.7348292040724 |
| Sum Squared Residuals | 4839.93543770543 |
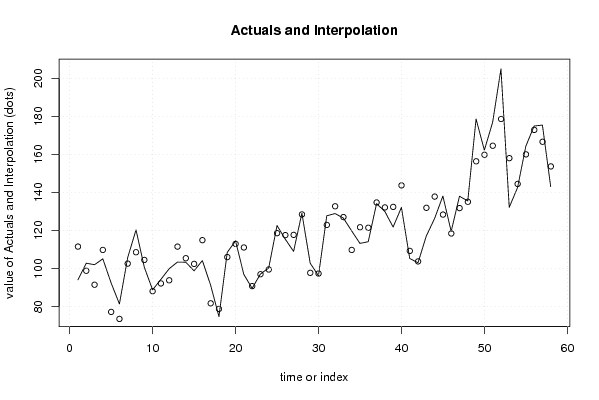
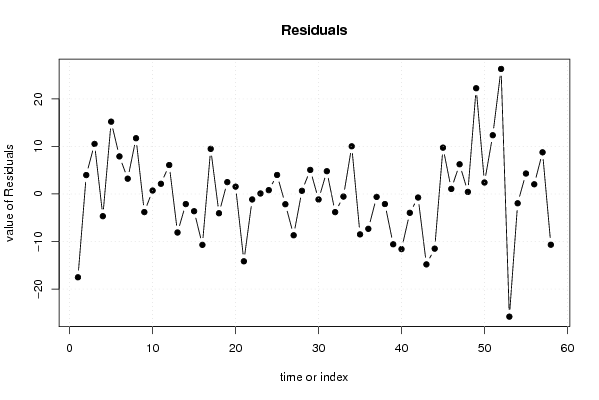
| Multiple Linear Regression - Actuals, Interpolation, and Residuals | |||
| Time or Index | Actuals | Interpolation Forecast | Residuals Prediction Error |
| 1 | 94 | 111.526026961989 | -17.5260269619891 |
| 2 | 102.8 | 98.8207045162244 | 3.97929548377559 |
| 3 | 102 | 91.4719687680362 | 10.5280312319638 |
| 4 | 105.1 | 109.767997757077 | -4.66799775707655 |
| 5 | 92.4 | 77.189081035128 | 15.2109189648720 |
| 6 | 81.4 | 73.496461447853 | 7.90353855214703 |
| 7 | 105.8 | 102.583375573452 | 3.21662442654812 |
| 8 | 120.3 | 108.568770814528 | 11.7312291854723 |
| 9 | 100.7 | 104.508525427262 | -3.80852542726190 |
| 10 | 88.8 | 88.078339098872 | 0.72166090112797 |
| 11 | 94.3 | 92.1570820497676 | 2.14291795023239 |
| 12 | 99.9 | 93.8093804189596 | 6.09061958104043 |
| 13 | 103.4 | 111.504534906634 | -8.1045349066338 |
| 14 | 103.3 | 105.420630950834 | -2.12063095083440 |
| 15 | 98.8 | 102.424753798245 | -3.62475379824532 |
| 16 | 104.2 | 114.902177656602 | -10.7021776566022 |
| 17 | 91.2 | 81.7090428112278 | 9.49095718877222 |
| 18 | 74.7 | 78.753185182263 | -4.05318518226307 |
| 19 | 108.5 | 106.003656075708 | 2.49634392429214 |
| 20 | 114.5 | 112.955225051854 | 1.54477494814626 |
| 21 | 96.9 | 111.061113330856 | -14.1611133308561 |
| 22 | 89.6 | 90.7477345343393 | -1.14773453433936 |
| 23 | 97.1 | 96.9943805758494 | 0.105619424150556 |
| 24 | 100.3 | 99.4966827876389 | 0.803317212361116 |
| 25 | 122.6 | 118.600820901142 | 3.99917909885836 |
| 26 | 115.4 | 117.556553596569 | -2.15655359656862 |
| 27 | 109 | 117.682184243423 | -8.68218424342315 |
| 28 | 129.1 | 128.437741600922 | 0.662258399077845 |
| 29 | 102.8 | 97.7363012918471 | 5.0636987081529 |
| 30 | 96.2 | 97.3534187546496 | -1.15341875464961 |
| 31 | 127.7 | 122.908919760596 | 4.7910802394042 |
| 32 | 128.9 | 132.714845572113 | -3.81484557211349 |
| 33 | 126.5 | 127.041182625866 | -0.541182625866083 |
| 34 | 119.8 | 109.769203116046 | 10.0307968839540 |
| 35 | 113.2 | 121.696316611343 | -8.49631661134311 |
| 36 | 114.1 | 121.425732265280 | -7.32573226528043 |
| 37 | 134.1 | 134.712722522752 | -0.612722522751562 |
| 38 | 130 | 132.114797168754 | -2.11479716875361 |
| 39 | 121.8 | 132.383400109267 | -10.5834001092673 |
| 40 | 132.1 | 143.693483375045 | -11.5934833750445 |
| 41 | 105.3 | 109.262610332221 | -3.96261033222091 |
| 42 | 103 | 103.741351812092 | -0.741351812091793 |
| 43 | 117.1 | 131.90763309382 | -14.80763309382 |
| 44 | 126.3 | 137.800283501499 | -11.5002835014988 |
| 45 | 138.1 | 128.353306088183 | 9.74669391181748 |
| 46 | 119.5 | 118.433337562866 | 1.06666243713393 |
| 47 | 138 | 131.752220763040 | 6.24777923696017 |
| 48 | 135.5 | 135.068204528121 | 0.431795471878913 |
| 49 | 178.6 | 156.355894707484 | 22.2441052925161 |
| 50 | 162.2 | 159.787313767619 | 2.41268623238103 |
| 51 | 176.9 | 164.537693081028 | 12.3623069189720 |
| 52 | 204.9 | 178.598599610355 | 26.3014003896454 |
| 53 | 132.2 | 158.002964529576 | -25.8029645295762 |
| 54 | 142.5 | 144.455582803143 | -1.95558280314255 |
| 55 | 164.3 | 159.996415496424 | 4.30358450357553 |
| 56 | 174.9 | 172.860875060006 | 2.03912493999372 |
| 57 | 175.4 | 166.635872527833 | 8.76412747216665 |
| 58 | 143 | 153.671385687877 | -10.6713856878766 |
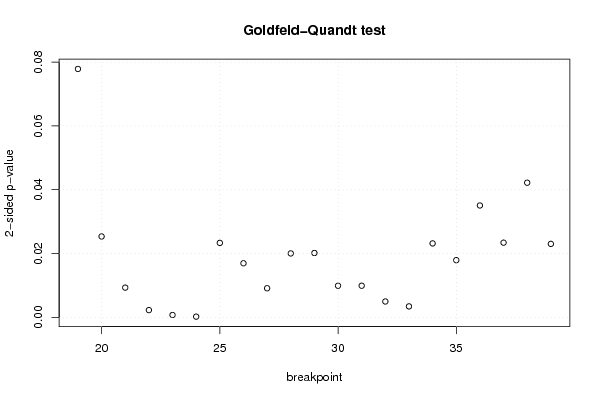
| Goldfeld-Quandt test for Heteroskedasticity | |||
| p-values | Alternative Hypothesis | ||
| breakpoint index | greater | 2-sided | less |
| 19 | 0.0389319129226628 | 0.0778638258453255 | 0.961068087077337 |
| 20 | 0.0126764774878179 | 0.0253529549756358 | 0.987323522512182 |
| 21 | 0.00465702070976327 | 0.00931404141952654 | 0.995342979290237 |
| 22 | 0.00113550647740209 | 0.00227101295480419 | 0.998864493522598 |
| 23 | 0.000368244520717436 | 0.000736489041434872 | 0.999631755479283 |
| 24 | 0.000107148114961678 | 0.000214296229923355 | 0.999892851885038 |
| 25 | 0.0116678349238369 | 0.0233356698476737 | 0.988332165076163 |
| 26 | 0.00847493414777761 | 0.0169498682955552 | 0.991525065852222 |
| 27 | 0.00455755196792109 | 0.00911510393584219 | 0.995442448032079 |
| 28 | 0.0100192920011902 | 0.0200385840023804 | 0.98998070799881 |
| 29 | 0.0100851157076389 | 0.0201702314152779 | 0.98991488429236 |
| 30 | 0.00494981167190423 | 0.00989962334380846 | 0.995050188328096 |
| 31 | 0.00495412156091279 | 0.00990824312182557 | 0.995045878439087 |
| 32 | 0.00248555632221438 | 0.00497111264442876 | 0.997514443677786 |
| 33 | 0.00171536397878457 | 0.00343072795756915 | 0.998284636021215 |
| 34 | 0.0115881101011608 | 0.0231762202023217 | 0.98841188989884 |
| 35 | 0.00896295950746945 | 0.0179259190149389 | 0.99103704049253 |
| 36 | 0.0175335068706913 | 0.0350670137413825 | 0.982466493129309 |
| 37 | 0.0117024050689604 | 0.0234048101379207 | 0.98829759493104 |
| 38 | 0.0211017911441281 | 0.0422035822882562 | 0.978898208855872 |
| 39 | 0.0115162988848305 | 0.0230325977696609 | 0.98848370111517 |
| Meta Analysis of Goldfeld-Quandt test for Heteroskedasticity | |||
| Description | # significant tests | % significant tests | OK/NOK |
| 1% type I error level | 9 | 0.428571428571429 | NOK |
| 5% type I error level | 20 | 0.952380952380952 | NOK |
| 10% type I error level | 21 | 1 | NOK |