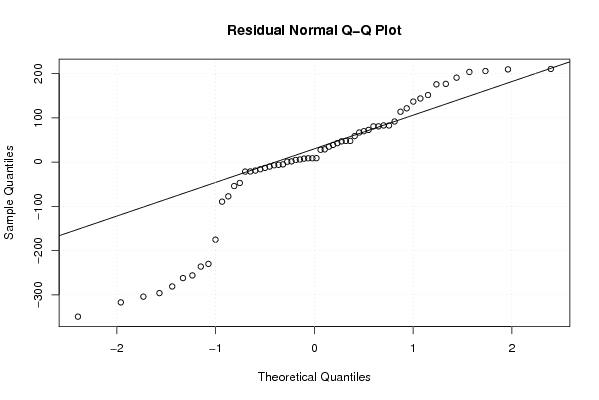
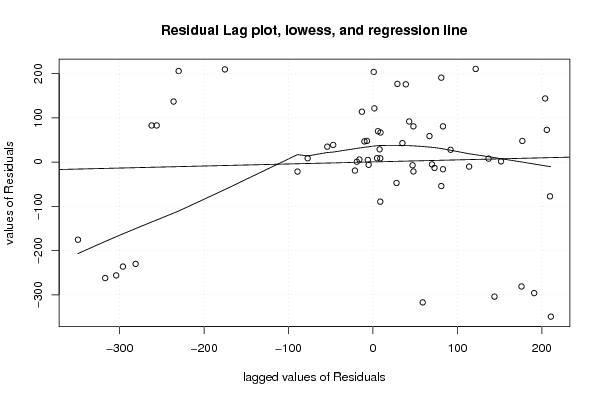
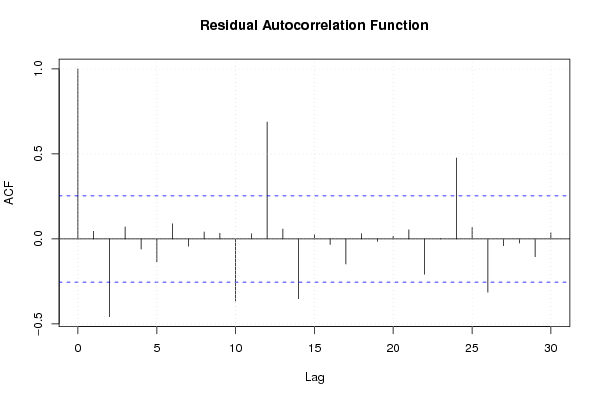
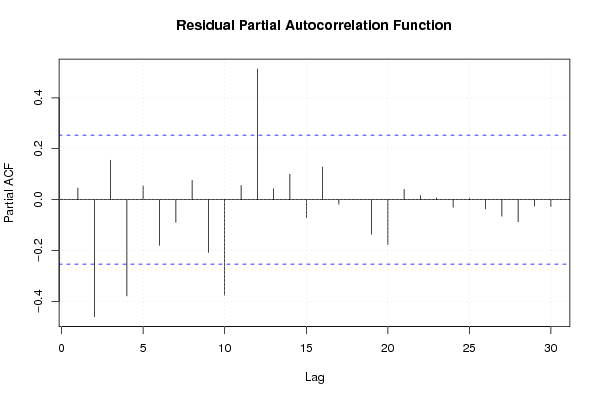
| Multiple Linear Regression - Estimated Regression Equation |
| Y[t] = + 648.083333333333 + 58.25X[t] + e[t] |
| Multiple Linear Regression - Ordinary Least Squares | |||||
| Variable | Parameter | S.D. | T-STAT H0: parameter = 0 | 2-tail p-value | 1-tail p-value |
| (Intercept) | 648.083333333333 | 20.799884 | 31.158 | 0 | 0 |
| X | 58.25 | 46.509955 | 1.2524 | 0.215443 | 0.107722 |
| Multiple Linear Regression - Regression Statistics | |
| Multiple R | 0.162271210903277 |
| R-squared | 0.0263319458880159 |
| Adjusted R-squared | 0.00954456564470596 |
| F-TEST (value) | 1.56855599303586 |
| F-TEST (DF numerator) | 1 |
| F-TEST (DF denominator) | 58 |
| p-value | 0.215443415878782 |
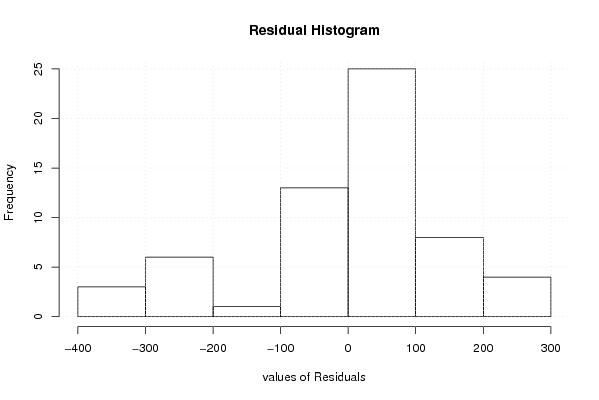
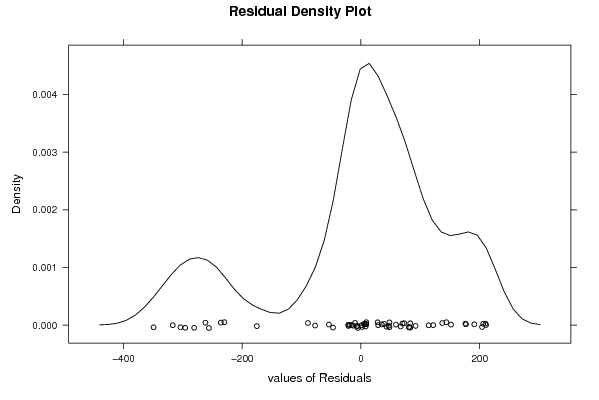
| Multiple Linear Regression - Residual Statistics | |
| Residual Standard Deviation | 144.105823982749 |
| Sum Squared Residuals | 1204456.33333333 |
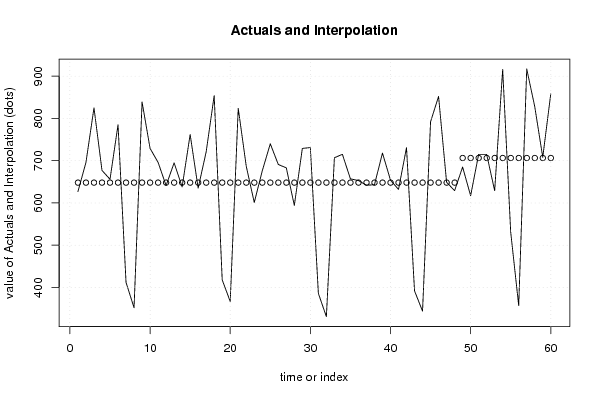
| Multiple Linear Regression - Actuals, Interpolation, and Residuals | |||
| Time or Index | Actuals | Interpolation Forecast | Residuals Prediction Error |
| 1 | 627 | 648.083333333334 | -21.0833333333342 |
| 2 | 696 | 648.083333333333 | 47.9166666666667 |
| 3 | 825 | 648.083333333333 | 176.916666666667 |
| 4 | 677 | 648.083333333333 | 28.9166666666667 |
| 5 | 656 | 648.083333333333 | 7.91666666666669 |
| 6 | 785 | 648.083333333333 | 136.916666666667 |
| 7 | 412 | 648.083333333333 | -236.083333333333 |
| 8 | 352 | 648.083333333333 | -296.083333333333 |
| 9 | 839 | 648.083333333333 | 190.916666666667 |
| 10 | 729 | 648.083333333333 | 80.9166666666667 |
| 11 | 696 | 648.083333333333 | 47.9166666666667 |
| 12 | 641 | 648.083333333333 | -7.08333333333331 |
| 13 | 695 | 648.083333333333 | 46.9166666666667 |
| 14 | 638 | 648.083333333333 | -10.0833333333333 |
| 15 | 762 | 648.083333333333 | 113.916666666667 |
| 16 | 635 | 648.083333333333 | -13.0833333333333 |
| 17 | 721 | 648.083333333333 | 72.9166666666667 |
| 18 | 854 | 648.083333333333 | 205.916666666667 |
| 19 | 418 | 648.083333333333 | -230.083333333333 |
| 20 | 367 | 648.083333333333 | -281.083333333333 |
| 21 | 824 | 648.083333333333 | 175.916666666667 |
| 22 | 687 | 648.083333333333 | 38.9166666666667 |
| 23 | 601 | 648.083333333333 | -47.0833333333333 |
| 24 | 676 | 648.083333333333 | 27.9166666666667 |
| 25 | 740 | 648.083333333333 | 91.9166666666667 |
| 26 | 691 | 648.083333333333 | 42.9166666666667 |
| 27 | 683 | 648.083333333333 | 34.9166666666667 |
| 28 | 594 | 648.083333333333 | -54.0833333333333 |
| 29 | 729 | 648.083333333333 | 80.9166666666667 |
| 30 | 731 | 648.083333333333 | 82.9166666666667 |
| 31 | 386 | 648.083333333333 | -262.083333333333 |
| 32 | 331 | 648.083333333333 | -317.083333333333 |
| 33 | 707 | 648.083333333333 | 58.9166666666667 |
| 34 | 715 | 648.083333333333 | 66.9166666666667 |
| 35 | 657 | 648.083333333333 | 8.91666666666669 |
| 36 | 653 | 648.083333333333 | 4.91666666666669 |
| 37 | 642 | 648.083333333333 | -6.08333333333331 |
| 38 | 643 | 648.083333333333 | -5.08333333333331 |
| 39 | 718 | 648.083333333333 | 69.9166666666667 |
| 40 | 654 | 648.083333333333 | 5.91666666666669 |
| 41 | 632 | 648.083333333333 | -16.0833333333333 |
| 42 | 731 | 648.083333333333 | 82.9166666666667 |
| 43 | 392 | 648.083333333333 | -256.083333333333 |
| 44 | 344 | 648.083333333333 | -304.083333333333 |
| 45 | 792 | 648.083333333333 | 143.916666666667 |
| 46 | 852 | 648.083333333333 | 203.916666666667 |
| 47 | 649 | 648.083333333333 | 0.916666666666687 |
| 48 | 629 | 648.083333333333 | -19.0833333333333 |
| 49 | 685 | 706.333333333333 | -21.3333333333333 |
| 50 | 617 | 706.333333333333 | -89.3333333333333 |
| 51 | 715 | 706.333333333333 | 8.66666666666666 |
| 52 | 715 | 706.333333333333 | 8.66666666666666 |
| 53 | 629 | 706.333333333333 | -77.3333333333333 |
| 54 | 916 | 706.333333333333 | 209.666666666667 |
| 55 | 531 | 706.333333333333 | -175.333333333333 |
| 56 | 357 | 706.333333333333 | -349.333333333333 |
| 57 | 917 | 706.333333333333 | 210.666666666667 |
| 58 | 828 | 706.333333333333 | 121.666666666667 |
| 59 | 708 | 706.333333333333 | 1.66666666666666 |
| 60 | 858 | 706.333333333333 | 151.666666666667 |
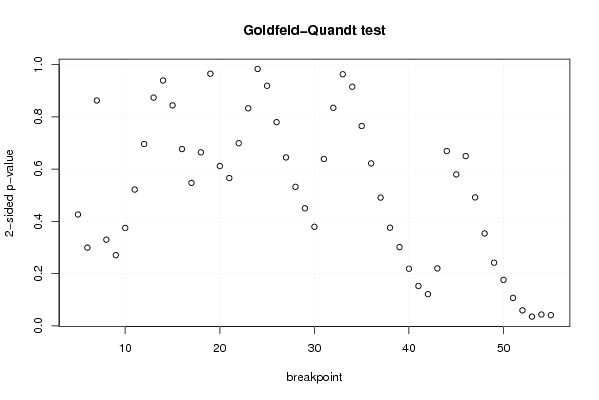
| Goldfeld-Quandt test for Heteroskedasticity | |||
| p-values | Alternative Hypothesis | ||
| breakpoint index | greater | 2-sided | less |
| 5 | 0.213097395454698 | 0.426194790909395 | 0.786902604545302 |
| 6 | 0.149692049435052 | 0.299384098870105 | 0.850307950564948 |
| 7 | 0.568665741360022 | 0.862668517279956 | 0.431334258639978 |
| 8 | 0.835095199931883 | 0.329809600136235 | 0.164904800068118 |
| 9 | 0.86469608960581 | 0.270607820788381 | 0.135303910394190 |
| 10 | 0.81260599380856 | 0.374788012382882 | 0.187394006191441 |
| 11 | 0.739191645652075 | 0.52161670869585 | 0.260808354347925 |
| 12 | 0.652008140887032 | 0.695983718225935 | 0.347991859112968 |
| 13 | 0.563121272315102 | 0.873757455369796 | 0.436878727684898 |
| 14 | 0.469605246252464 | 0.939210492504927 | 0.530394753747536 |
| 15 | 0.421971716623084 | 0.843943433246169 | 0.578028283376916 |
| 16 | 0.338309452993678 | 0.676618905987357 | 0.661690547006322 |
| 17 | 0.27365347649963 | 0.54730695299926 | 0.72634652350037 |
| 18 | 0.332070065671589 | 0.664140131343178 | 0.667929934328411 |
| 19 | 0.482514846138422 | 0.965029692276845 | 0.517485153861578 |
| 20 | 0.694240635006335 | 0.61151872998733 | 0.305759364993665 |
| 21 | 0.71714982082817 | 0.565700358343659 | 0.282850179171830 |
| 22 | 0.650427989577829 | 0.699144020844343 | 0.349572010422171 |
| 23 | 0.583679100261713 | 0.832641799476575 | 0.416320899738287 |
| 24 | 0.508309047225072 | 0.983381905549856 | 0.491690952774928 |
| 25 | 0.459447886919193 | 0.918895773838385 | 0.540552113080807 |
| 26 | 0.389860769790743 | 0.779721539581486 | 0.610139230209257 |
| 27 | 0.322342391110202 | 0.644684782220404 | 0.677657608889798 |
| 28 | 0.266050504005632 | 0.532101008011264 | 0.733949495994368 |
| 29 | 0.224944099768100 | 0.449888199536199 | 0.7750559002319 |
| 30 | 0.189546590702056 | 0.379093181404112 | 0.810453409297944 |
| 31 | 0.319383026178417 | 0.638766052356834 | 0.680616973821583 |
| 32 | 0.582644265001128 | 0.834711469997744 | 0.417355734998872 |
| 33 | 0.518382286984269 | 0.963235426031462 | 0.481617713015731 |
| 34 | 0.4576565235588 | 0.9153130471176 | 0.5423434764412 |
| 35 | 0.382431141110678 | 0.764862282221355 | 0.617568858889322 |
| 36 | 0.310918422343325 | 0.62183684468665 | 0.689081577656675 |
| 37 | 0.245447541312115 | 0.49089508262423 | 0.754552458687885 |
| 38 | 0.187882472275064 | 0.375764944550128 | 0.812117527724936 |
| 39 | 0.150678264648880 | 0.301356529297759 | 0.84932173535112 |
| 40 | 0.109232702885476 | 0.218465405770951 | 0.890767297114524 |
| 41 | 0.076221055346219 | 0.152442110692438 | 0.923778944653781 |
| 42 | 0.0606108132704026 | 0.121221626540805 | 0.939389186729597 |
| 43 | 0.109919774524394 | 0.219839549048788 | 0.890080225475606 |
| 44 | 0.33450827191118 | 0.66901654382236 | 0.66549172808882 |
| 45 | 0.2898114626117 | 0.5796229252234 | 0.7101885373883 |
| 46 | 0.324839429570641 | 0.649678859141283 | 0.675160570429359 |
| 47 | 0.245845296811658 | 0.491690593623316 | 0.754154703188342 |
| 48 | 0.176878057249624 | 0.353756114499247 | 0.823121942750376 |
| 49 | 0.120827171477645 | 0.24165434295529 | 0.879172828522355 |
| 50 | 0.0879536778627967 | 0.175907355725593 | 0.912046322137203 |
| 51 | 0.0534413782754709 | 0.106882756550942 | 0.94655862172453 |
| 52 | 0.0296614496878911 | 0.0593228993757822 | 0.97033855031211 |
| 53 | 0.0175548174306988 | 0.0351096348613977 | 0.982445182569301 |
| 54 | 0.0216013393094702 | 0.0432026786189405 | 0.97839866069053 |
| 55 | 0.0203794627474820 | 0.0407589254949641 | 0.979620537252518 |
| Meta Analysis of Goldfeld-Quandt test for Heteroskedasticity | |||
| Description | # significant tests | % significant tests | OK/NOK |
| 1% type I error level | 0 | 0 | OK |
| 5% type I error level | 3 | 0.0588235294117647 | NOK |
| 10% type I error level | 4 | 0.0784313725490196 | OK |