| Multiple Linear Regression - Estimated Regression Equation |
| Y[t] = + 679.75 + 58.25X[t] -13.6000000000002M1[t] -34.4000000000001M2[t] + 49.1999999999999M3[t] -36.3999999999999M4[t] -18.0000000000001M5[t] + 112M6[t] -263.600000000000M7[t] -341.2M8[t] + 124.4M9[t] + 70.8M10[t] -29.2M11[t] + e[t] |
| Multiple Linear Regression - Ordinary Least Squares | |||||
| Variable | Parameter | S.D. | T-STAT H0: parameter = 0 | 2-tail p-value | 1-tail p-value |
| (Intercept) | 679.75 | 24.528193 | 27.713 | 0 | 0 |
| X | 58.25 | 17.520138 | 3.3247 | 0.001722 | 0.000861 |
| M1 | -13.6000000000002 | 34.332318 | -0.3961 | 0.693803 | 0.346902 |
| M2 | -34.4000000000001 | 34.332318 | -1.002 | 0.321488 | 0.160744 |
| M3 | 49.1999999999999 | 34.332318 | 1.4331 | 0.158462 | 0.079231 |
| M4 | -36.3999999999999 | 34.332318 | -1.0602 | 0.29446 | 0.14723 |
| M5 | -18.0000000000001 | 34.332318 | -0.5243 | 0.602543 | 0.301271 |
| M6 | 112 | 34.332318 | 3.2622 | 0.002062 | 0.001031 |
| M7 | -263.600000000000 | 34.332318 | -7.6779 | 0 | 0 |
| M8 | -341.2 | 34.332318 | -9.9382 | 0 | 0 |
| M9 | 124.4 | 34.332318 | 3.6234 | 0.000712 | 0.000356 |
| M10 | 70.8 | 34.332318 | 2.0622 | 0.044741 | 0.022371 |
| M11 | -29.2 | 34.332318 | -0.8505 | 0.399354 | 0.199677 |
| Multiple Linear Regression - Regression Statistics | |
| Multiple R | 0.94235859215616 |
| R-squared | 0.88803971621054 |
| Adjusted R-squared | 0.859454111838763 |
| F-TEST (value) | 31.0659765895072 |
| F-TEST (DF numerator) | 12 |
| F-TEST (DF denominator) | 47 |
| p-value | 0 |
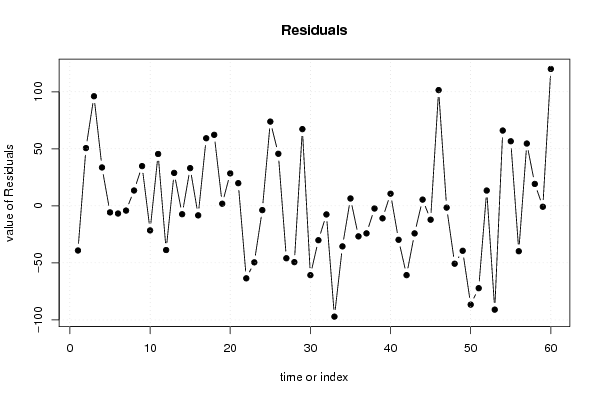
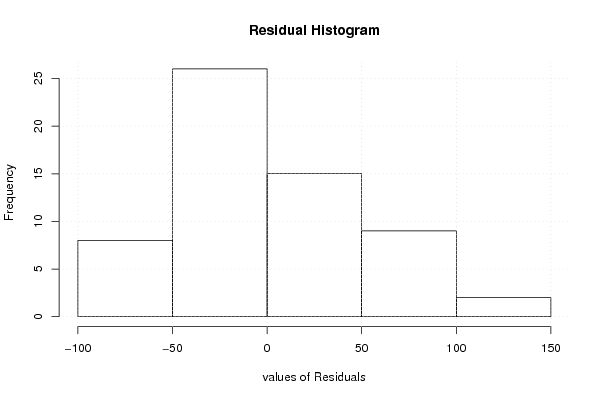
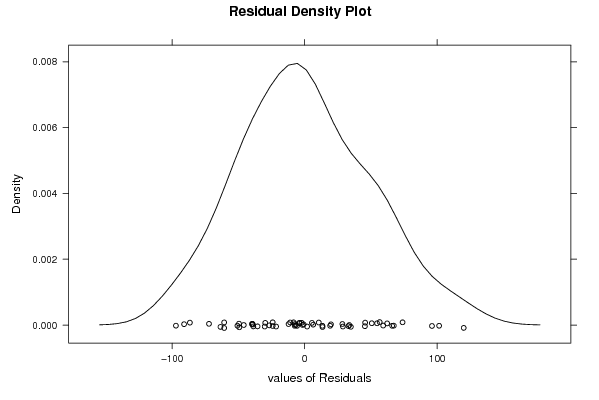
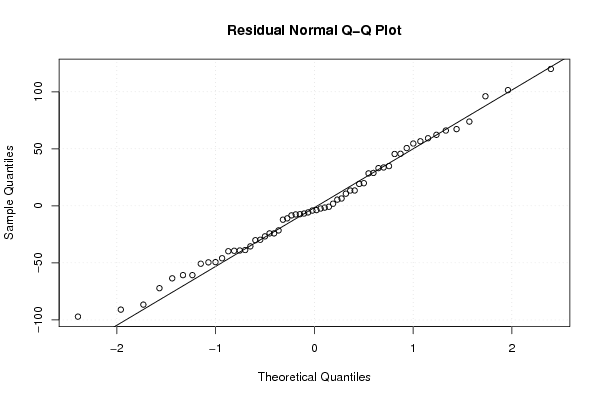
| Multiple Linear Regression - Residual Statistics | |
| Residual Standard Deviation | 54.2841617119207 |
| Sum Squared Residuals | 138498.2 |
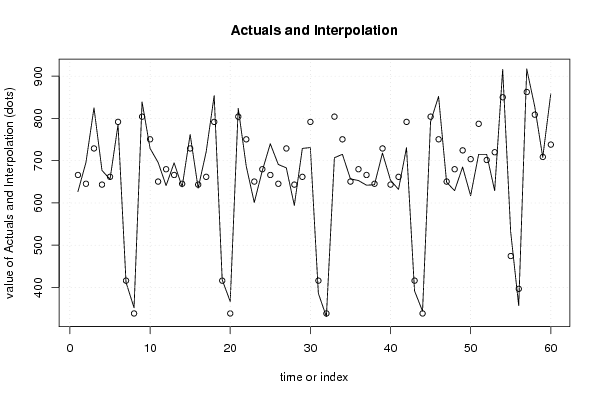
| Multiple Linear Regression - Actuals, Interpolation, and Residuals | |||
| Time or Index | Actuals | Interpolation Forecast | Residuals Prediction Error |
| 1 | 627 | 666.15 | -39.1500000000007 |
| 2 | 696 | 645.35 | 50.6499999999999 |
| 3 | 825 | 728.95 | 96.05 |
| 4 | 677 | 643.35 | 33.65 |
| 5 | 656 | 661.75 | -5.74999999999988 |
| 6 | 785 | 791.75 | -6.75000000000002 |
| 7 | 412 | 416.15 | -4.14999999999964 |
| 8 | 352 | 338.55 | 13.4500000000000 |
| 9 | 839 | 804.15 | 34.8499999999998 |
| 10 | 729 | 750.55 | -21.5500000000001 |
| 11 | 696 | 650.55 | 45.4500000000001 |
| 12 | 641 | 679.75 | -38.75 |
| 13 | 695 | 666.15 | 28.8500000000002 |
| 14 | 638 | 645.35 | -7.34999999999995 |
| 15 | 762 | 728.95 | 33.05 |
| 16 | 635 | 643.35 | -8.35000000000002 |
| 17 | 721 | 661.75 | 59.25 |
| 18 | 854 | 791.75 | 62.25 |
| 19 | 418 | 416.15 | 1.84999999999994 |
| 20 | 367 | 338.55 | 28.4500000000000 |
| 21 | 824 | 804.15 | 19.8500000000001 |
| 22 | 687 | 750.55 | -63.55 |
| 23 | 601 | 650.55 | -49.55 |
| 24 | 676 | 679.75 | -3.74999999999999 |
| 25 | 740 | 666.15 | 73.8500000000002 |
| 26 | 691 | 645.35 | 45.65 |
| 27 | 683 | 728.95 | -45.95 |
| 28 | 594 | 643.35 | -49.35 |
| 29 | 729 | 661.75 | 67.25 |
| 30 | 731 | 791.75 | -60.75 |
| 31 | 386 | 416.15 | -30.1500000000001 |
| 32 | 331 | 338.55 | -7.54999999999994 |
| 33 | 707 | 804.15 | -97.15 |
| 34 | 715 | 750.55 | -35.55 |
| 35 | 657 | 650.55 | 6.44999999999998 |
| 36 | 653 | 679.75 | -26.75 |
| 37 | 642 | 666.15 | -24.1499999999998 |
| 38 | 643 | 645.35 | -2.34999999999995 |
| 39 | 718 | 728.95 | -10.9500000000000 |
| 40 | 654 | 643.35 | 10.6500000000000 |
| 41 | 632 | 661.75 | -29.7500000000000 |
| 42 | 731 | 791.75 | -60.75 |
| 43 | 392 | 416.15 | -24.1500000000001 |
| 44 | 344 | 338.55 | 5.45000000000005 |
| 45 | 792 | 804.15 | -12.1499999999999 |
| 46 | 852 | 750.55 | 101.45 |
| 47 | 649 | 650.55 | -1.55000000000002 |
| 48 | 629 | 679.75 | -50.75 |
| 49 | 685 | 724.4 | -39.3999999999998 |
| 50 | 617 | 703.6 | -86.6 |
| 51 | 715 | 787.2 | -72.2 |
| 52 | 715 | 701.6 | 13.4000000000000 |
| 53 | 629 | 720 | -91 |
| 54 | 916 | 850 | 66 |
| 55 | 531 | 474.4 | 56.5999999999999 |
| 56 | 357 | 396.8 | -39.8000000000001 |
| 57 | 917 | 862.4 | 54.6000000000001 |
| 58 | 828 | 808.8 | 19.2000000000000 |
| 59 | 708 | 708.8 | -0.800000000000057 |
| 60 | 858 | 738 | 120 |
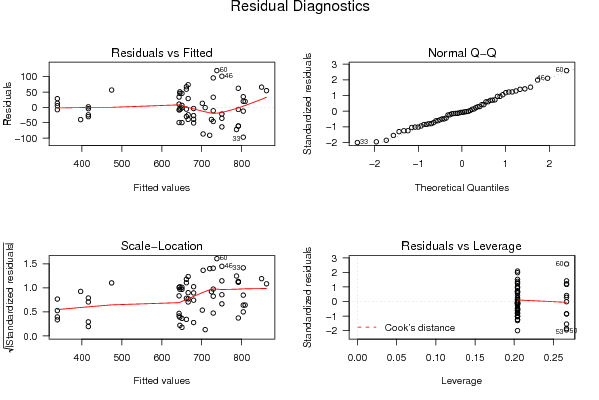
| Goldfeld-Quandt test for Heteroskedasticity | |||
| p-values | Alternative Hypothesis | ||
| breakpoint index | greater | 2-sided | less |
| 16 | 0.414384583051877 | 0.828769166103754 | 0.585615416948123 |
| 17 | 0.369488128313027 | 0.738976256626053 | 0.630511871686974 |
| 18 | 0.352133509691225 | 0.70426701938245 | 0.647866490308775 |
| 19 | 0.22802041461536 | 0.45604082923072 | 0.77197958538464 |
| 20 | 0.145381882697996 | 0.290763765395992 | 0.854618117302004 |
| 21 | 0.0879435580538189 | 0.175887116107638 | 0.912056441946181 |
| 22 | 0.0706038655450504 | 0.141207731090101 | 0.92939613445495 |
| 23 | 0.104135079323896 | 0.208270158647792 | 0.895864920676104 |
| 24 | 0.0688143662381836 | 0.137628732476367 | 0.931185633761816 |
| 25 | 0.110603992248883 | 0.221207984497766 | 0.889396007751117 |
| 26 | 0.0958697566987357 | 0.191739513397471 | 0.904130243301264 |
| 27 | 0.163096544642818 | 0.326193089285635 | 0.836903455357182 |
| 28 | 0.1508374635655 | 0.3016749271310 | 0.8491625364345 |
| 29 | 0.203020910254333 | 0.406041820508666 | 0.796979089745667 |
| 30 | 0.232412057991474 | 0.464824115982948 | 0.767587942008526 |
| 31 | 0.178788730686450 | 0.357577461372901 | 0.82121126931355 |
| 32 | 0.128794591838127 | 0.257589183676255 | 0.871205408161873 |
| 33 | 0.273552827037235 | 0.547105654074471 | 0.726447172962765 |
| 34 | 0.270574898271389 | 0.541149796542778 | 0.729425101728611 |
| 35 | 0.195251875663702 | 0.390503751327404 | 0.804748124336298 |
| 36 | 0.155811430560086 | 0.311622861120171 | 0.844188569439914 |
| 37 | 0.115034752478692 | 0.230069504957384 | 0.884965247521308 |
| 38 | 0.119202391009998 | 0.238404782019997 | 0.880797608990002 |
| 39 | 0.114728562740669 | 0.229457125481338 | 0.885271437259331 |
| 40 | 0.0726704504062712 | 0.145340900812542 | 0.927329549593729 |
| 41 | 0.0947280308337312 | 0.189456061667462 | 0.905271969166269 |
| 42 | 0.101369779015440 | 0.202739558030879 | 0.89863022098456 |
| 43 | 0.0663667695031637 | 0.132733539006327 | 0.933633230496836 |
| 44 | 0.0499549791120581 | 0.0999099582241162 | 0.950045020887942 |
| Meta Analysis of Goldfeld-Quandt test for Heteroskedasticity | |||
| Description | # significant tests | % significant tests | OK/NOK |
| 1% type I error level | 0 | 0 | OK |
| 5% type I error level | 0 | 0 | OK |
| 10% type I error level | 1 | 0.0344827586206897 | OK |