| Multiple Linear Regression - Estimated Regression Equation |
| y[t] = + 1.26367368122718 + 0.00440114533689808x[t] + 1.40345082424960y1[t] -0.576928969828826y2[t] + 0.006338650422903M1[t] -0.207233201114077M2[t] -0.214352974333265M3[t] -0.243844989034858M4[t] -0.197231539999112M5[t] -0.279849567342826M6[t] + 0.0186804379108398M7[t] -0.414227973933947M8[t] -0.269348540276246M9[t] -0.278787619681992M10[t] -0.183889745448256M11[t] -0.00166891303737878t + e[t] |
| Multiple Linear Regression - Ordinary Least Squares | |||||
| Variable | Parameter | S.D. | T-STAT H0: parameter = 0 | 2-tail p-value | 1-tail p-value |
| (Intercept) | 1.26367368122718 | 0.460064 | 2.7467 | 0.00915 | 0.004575 |
| x | 0.00440114533689808 | 0.099783 | 0.0441 | 0.96505 | 0.482525 |
| y1 | 1.40345082424960 | 0.138376 | 10.1423 | 0 | 0 |
| y2 | -0.576928969828826 | 0.145249 | -3.972 | 0.000307 | 0.000153 |
| M1 | 0.006338650422903 | 0.133777 | 0.0474 | 0.962457 | 0.481228 |
| M2 | -0.207233201114077 | 0.141044 | -1.4693 | 0.149987 | 0.074994 |
| M3 | -0.214352974333265 | 0.141761 | -1.5121 | 0.138788 | 0.069394 |
| M4 | -0.243844989034858 | 0.14406 | -1.6927 | 0.098706 | 0.049353 |
| M5 | -0.197231539999112 | 0.143918 | -1.3704 | 0.178591 | 0.089296 |
| M6 | -0.279849567342826 | 0.139771 | -2.0022 | 0.052437 | 0.026219 |
| M7 | 0.0186804379108398 | 0.14162 | 0.1319 | 0.895755 | 0.447878 |
| M8 | -0.414227973933947 | 0.135264 | -3.0624 | 0.004021 | 0.002011 |
| M9 | -0.269348540276246 | 0.137015 | -1.9658 | 0.056657 | 0.028328 |
| M10 | -0.278787619681992 | 0.13519 | -2.0622 | 0.046076 | 0.023038 |
| M11 | -0.183889745448256 | 0.134215 | -1.3701 | 0.178691 | 0.089346 |
| t | -0.00166891303737878 | 0.003155 | -0.529 | 0.599913 | 0.299957 |
| Multiple Linear Regression - Regression Statistics | |
| Multiple R | 0.956170284263282 |
| R-squared | 0.914261612508126 |
| Adjusted R-squared | 0.880417512182387 |
| F-TEST (value) | 27.0139139084398 |
| F-TEST (DF numerator) | 15 |
| F-TEST (DF denominator) | 38 |
| p-value | 1.11022302462516e-15 |
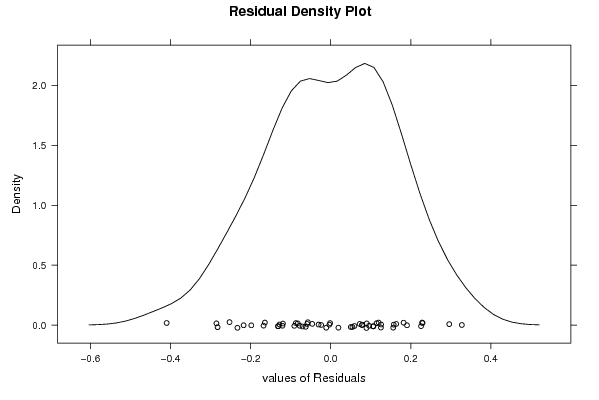
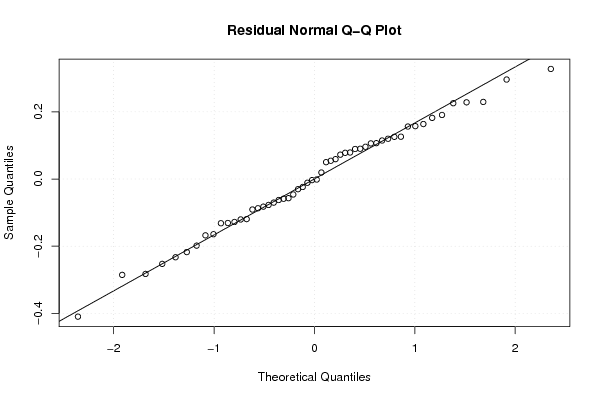
| Multiple Linear Regression - Residual Statistics | |
| Residual Standard Deviation | 0.188181322950762 |
| Sum Squared Residuals | 1.34566399168495 |
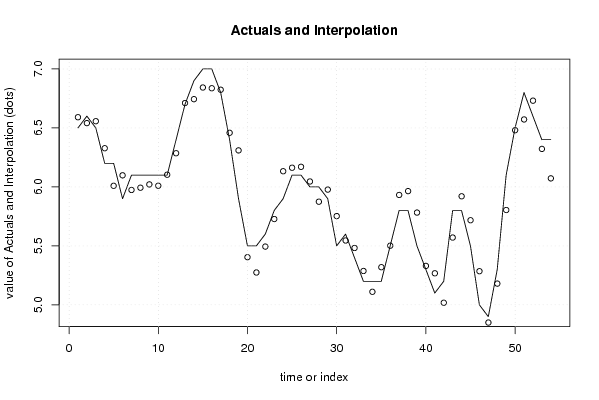
| Multiple Linear Regression - Actuals, Interpolation, and Residuals | |||
| Time or Index | Actuals | Interpolation Forecast | Residuals Prediction Error |
| 1 | 6.5 | 6.59081689542933 | -0.0908168954293293 |
| 2 | 6.6 | 6.54088050173912 | 0.0591194982608785 |
| 3 | 6.5 | 6.55705110394175 | -0.0570511039417492 |
| 4 | 6.2 | 6.32785219679493 | -0.127852196794934 |
| 5 | 6.2 | 6.0094543825013 | 0.190545617498696 |
| 6 | 5.9 | 6.09824613306886 | -0.198246133068860 |
| 7 | 6.1 | 5.97407197801027 | 0.125928021989732 |
| 8 | 6.1 | 5.99326350892667 | 0.106736491073331 |
| 9 | 6.1 | 6.02108823558123 | 0.0789117644187742 |
| 10 | 6.1 | 6.0099802431381 | 0.0900197568618983 |
| 11 | 6.1 | 6.10320920433446 | -0.00320920433445819 |
| 12 | 6.4 | 6.28543003674533 | 0.114569963254665 |
| 13 | 6.7 | 6.71113502140574 | -0.0111350214057395 |
| 14 | 6.9 | 6.74385081315761 | 0.156149186842389 |
| 15 | 7 | 6.84267360080232 | 0.157326399197683 |
| 16 | 7 | 6.83647196152254 | 0.163528038477462 |
| 17 | 6.8 | 6.82372360053802 | -0.0237236005380234 |
| 18 | 6.4 | 6.45874649530701 | -0.0587464953070114 |
| 19 | 5.9 | 6.30961305178923 | -0.409613051789225 |
| 20 | 5.5 | 5.40408190271379 | 0.0959180972862084 |
| 21 | 5.5 | 5.27437657854869 | 0.225623421451313 |
| 22 | 5.6 | 5.49404017403709 | 0.105959825962906 |
| 23 | 5.8 | 5.72761421765841 | 0.0723857823415904 |
| 24 | 5.9 | 6.13283231793632 | -0.232832317936324 |
| 25 | 6.1 | 6.16246134378104 | -0.0624613437810437 |
| 26 | 6.1 | 6.17021784707372 | -0.0702178470737203 |
| 27 | 6 | 6.04604336685139 | -0.0460433668513886 |
| 28 | 6 | 5.87453735668746 | 0.125462643312543 |
| 29 | 5.9 | 5.97717478966871 | -0.0771747896687065 |
| 30 | 5.5 | 5.75254276686266 | -0.252542766862656 |
| 31 | 5.6 | 5.54571642636199 | 0.0542835736380142 |
| 32 | 5.4 | 5.48225577183631 | -0.0822557718363094 |
| 33 | 5.2 | 5.28708323062383 | -0.0870832306238308 |
| 34 | 5.2 | 5.11067086729655 | 0.0893291327034486 |
| 35 | 5.2 | 5.31928562245867 | -0.119285622458673 |
| 36 | 5.5 | 5.50150645486955 | -0.00150645486955109 |
| 37 | 5.8 | 5.93161258486685 | -0.131612584866852 |
| 38 | 5.8 | 5.96432837661872 | -0.164328376618725 |
| 39 | 5.5 | 5.78246099941351 | -0.28246099941351 |
| 40 | 5.3 | 5.33026482439966 | -0.0302648243996594 |
| 41 | 5.1 | 5.26759788649675 | -0.167597886496755 |
| 42 | 5.2 | 5.01800657523151 | 0.181993424768492 |
| 43 | 5.8 | 5.57059854383852 | 0.229401456161479 |
| 44 | 5.8 | 5.92039881652323 | -0.12039881652323 |
| 45 | 5.5 | 5.71745195524626 | -0.217451955246256 |
| 46 | 5 | 5.28530871552825 | -0.285308715528253 |
| 47 | 4.9 | 4.84989095554846 | 0.0501090444515413 |
| 48 | 5.3 | 5.18023119044879 | 0.119768809551209 |
| 49 | 6.1 | 5.80397415451703 | 0.296025845482965 |
| 50 | 6.5 | 6.48072246141082 | 0.019277538589177 |
| 51 | 6.8 | 6.57177092899104 | 0.228229071008965 |
| 52 | 6.6 | 6.73087366059541 | -0.130873660595411 |
| 53 | 6.4 | 6.32204934079521 | 0.0779506592047891 |
| 54 | 6.4 | 6.07245802952997 | 0.327541970470034 |
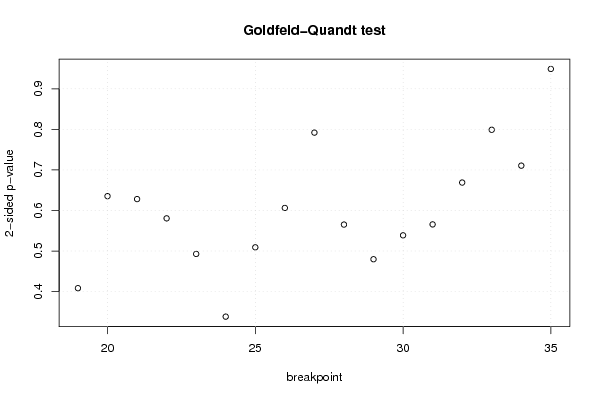
| Goldfeld-Quandt test for Heteroskedasticity | |||
| p-values | Alternative Hypothesis | ||
| breakpoint index | greater | 2-sided | less |
| 19 | 0.795783884580208 | 0.408432230839585 | 0.204216115419792 |
| 20 | 0.682348534736579 | 0.635302930526843 | 0.317651465263421 |
| 21 | 0.685941039915583 | 0.628117920168835 | 0.314058960084417 |
| 22 | 0.709704610357758 | 0.580590779284485 | 0.290295389642242 |
| 23 | 0.753595469592615 | 0.492809060814769 | 0.246404530407384 |
| 24 | 0.83089636400324 | 0.338207271993522 | 0.169103635996761 |
| 25 | 0.74542956007117 | 0.509140879857659 | 0.254570439928830 |
| 26 | 0.696898511792478 | 0.606202976415045 | 0.303101488207523 |
| 27 | 0.604022630547026 | 0.791954738905948 | 0.395977369452974 |
| 28 | 0.717394918821008 | 0.565210162357983 | 0.282605081178992 |
| 29 | 0.760123537324182 | 0.479752925351636 | 0.239876462675818 |
| 30 | 0.730642270146895 | 0.53871545970621 | 0.269357729853105 |
| 31 | 0.71714998259752 | 0.565700034804958 | 0.282850017402479 |
| 32 | 0.665587924323412 | 0.668824151353176 | 0.334412075676588 |
| 33 | 0.600538382165116 | 0.798923235669768 | 0.399461617834884 |
| 34 | 0.644755659817614 | 0.710488680364771 | 0.355244340182386 |
| 35 | 0.474473686778345 | 0.94894737355669 | 0.525526313221655 |
| Meta Analysis of Goldfeld-Quandt test for Heteroskedasticity | |||
| Description | # significant tests | % significant tests | OK/NOK |
| 1% type I error level | 0 | 0 | OK |
| 5% type I error level | 0 | 0 | OK |
| 10% type I error level | 0 | 0 | OK |