| Multiple Linear Regression - Estimated Regression Equation |
| Y[t] = + 0.539091205777179 + 0.573438557956526X[t] + 1.02829851557690Y1[t] + 0.0269671841106094Y2[t] + 0.0328180088795993Y3[t] -0.210413134181968Y4[t] + 0.136004659282262M1[t] -0.0605367365174084M2[t] + 0.0399923932085476M3[t] + 0.0210278026729679M4[t] + 0.120045150787521M5[t] -0.137283584804756M6[t] + 0.119908563240552M7[t] -0.0320928698935266M8[t] -0.136438669654607M9[t] -0.00629145184081034M10[t] + 0.196689637957487M11[t] -0.0196778006990444t + e[t] |
| Multiple Linear Regression - Ordinary Least Squares | |||||
| Variable | Parameter | S.D. | T-STAT H0: parameter = 0 | 2-tail p-value | 1-tail p-value |
| (Intercept) | 0.539091205777179 | 0.375288 | 1.4365 | 0.15905 | 0.079525 |
| X | 0.573438557956526 | 0.32511 | 1.7638 | 0.0858 | 0.0429 |
| Y1 | 1.02829851557690 | 0.160039 | 6.4253 | 0 | 0 |
| Y2 | 0.0269671841106094 | 0.242223 | 0.1113 | 0.911939 | 0.455969 |
| Y3 | 0.0328180088795993 | 0.254511 | 0.1289 | 0.898081 | 0.44904 |
| Y4 | -0.210413134181968 | 0.175993 | -1.1956 | 0.239269 | 0.119634 |
| M1 | 0.136004659282262 | 0.367371 | 0.3702 | 0.713281 | 0.356641 |
| M2 | -0.0605367365174084 | 0.366645 | -0.1651 | 0.869733 | 0.434866 |
| M3 | 0.0399923932085476 | 0.368788 | 0.1084 | 0.914215 | 0.457108 |
| M4 | 0.0210278026729679 | 0.369717 | 0.0569 | 0.954943 | 0.477471 |
| M5 | 0.120045150787521 | 0.367397 | 0.3267 | 0.745653 | 0.372827 |
| M6 | -0.137283584804756 | 0.369555 | -0.3715 | 0.712341 | 0.35617 |
| M7 | 0.119908563240552 | 0.371871 | 0.3224 | 0.748882 | 0.374441 |
| M8 | -0.0320928698935266 | 0.369313 | -0.0869 | 0.931208 | 0.465604 |
| M9 | -0.136438669654607 | 0.386666 | -0.3529 | 0.726144 | 0.363072 |
| M10 | -0.00629145184081034 | 0.388555 | -0.0162 | 0.987166 | 0.493583 |
| M11 | 0.196689637957487 | 0.387853 | 0.5071 | 0.614998 | 0.307499 |
| t | -0.0196778006990444 | 0.010447 | -1.8836 | 0.067289 | 0.033645 |
| Multiple Linear Regression - Regression Statistics | |
| Multiple R | 0.959090455556404 |
| R-squared | 0.919854501939391 |
| Adjusted R-squared | 0.88399993701754 |
| F-TEST (value) | 25.6551572706100 |
| F-TEST (DF numerator) | 17 |
| F-TEST (DF denominator) | 38 |
| p-value | 9.9920072216264e-16 |
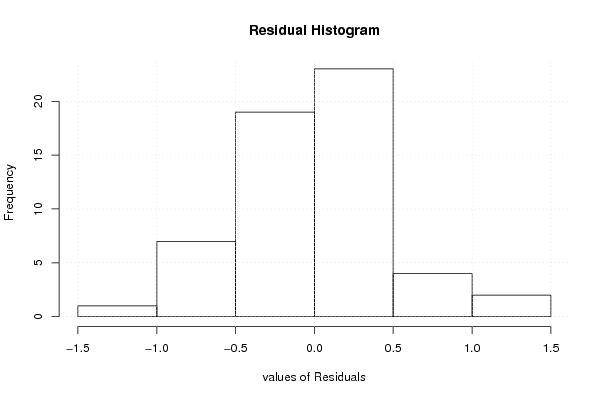
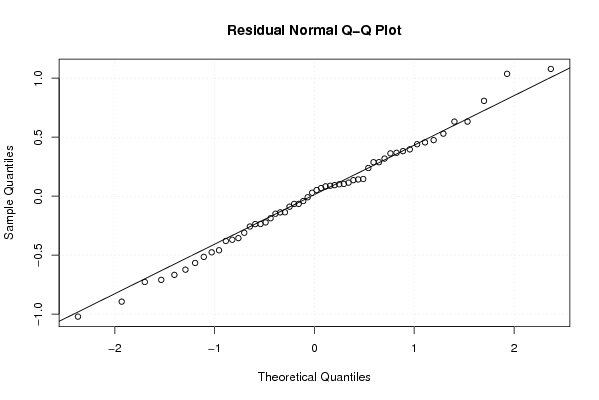
| Multiple Linear Regression - Residual Statistics | |
| Residual Standard Deviation | 0.542700801466578 |
| Sum Squared Residuals | 11.1919180766737 |
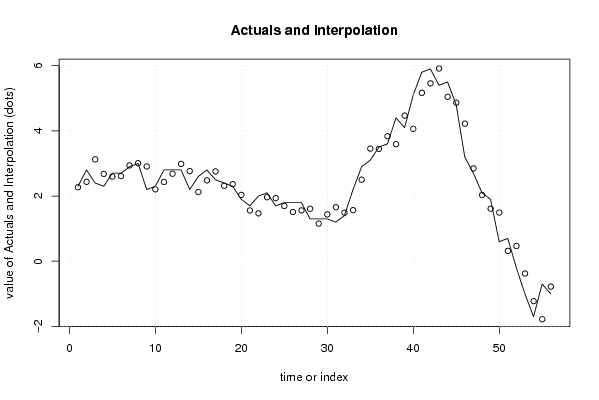
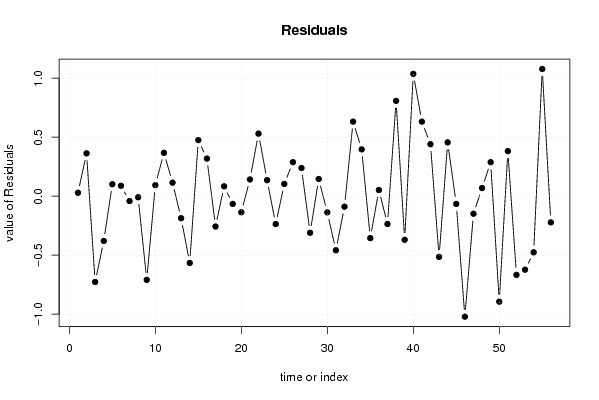
| Multiple Linear Regression - Actuals, Interpolation, and Residuals | |||
| Time or Index | Actuals | Interpolation Forecast | Residuals Prediction Error |
| 1 | 2.3 | 2.27061870345612 | 0.0293812965438833 |
| 2 | 2.8 | 2.43662383016248 | 0.363376169837522 |
| 3 | 2.4 | 3.12716162677177 | -0.727161626771766 |
| 4 | 2.3 | 2.67948751060737 | -0.379487510607374 |
| 5 | 2.7 | 2.59849539700616 | 0.101504602993843 |
| 6 | 2.7 | 2.61177777789171 | 0.0882222221082889 |
| 7 | 2.9 | 2.94096245166705 | -0.0409624516670454 |
| 8 | 3 | 3.00911143791934 | -0.00911143791933824 |
| 9 | 2.2 | 2.90914587216624 | -0.709145872166238 |
| 10 | 2.3 | 2.20623679700645 | 0.0937632029935468 |
| 11 | 2.8 | 2.43199536442647 | 0.368004635573525 |
| 12 | 2.8 | 2.68517818144758 | 0.114821818552423 |
| 13 | 2.8 | 2.98660094031963 | -0.186600940319633 |
| 14 | 2.2 | 2.76574943484252 | -0.565749434842521 |
| 15 | 2.6 | 2.12441508743231 | 0.475584912567689 |
| 16 | 2.8 | 2.48091179196208 | 0.31908820803792 |
| 17 | 2.5 | 2.75700711080945 | -0.257007110809452 |
| 18 | 2.4 | 2.31627954072820 | 0.0837204592717956 |
| 19 | 2.3 | 2.36527222938673 | -0.0652722293867272 |
| 20 | 1.9 | 2.03613839608458 | -0.136138396084581 |
| 21 | 1.7 | 1.55794081034927 | 0.142059189650733 |
| 22 | 2 | 1.46972316323463 | 0.530276836765368 |
| 23 | 2.1 | 1.96403668005119 | 0.13596331994881 |
| 24 | 1.7 | 1.9361909000824 | -0.236190900082398 |
| 25 | 1.8 | 1.69582310034619 | 0.104176899653810 |
| 26 | 1.8 | 1.51180474239429 | 0.288195257605708 |
| 27 | 1.8 | 1.56118427286223 | 0.238815727137772 |
| 28 | 1.3 | 1.60998893618835 | -0.309988936188351 |
| 29 | 1.3 | 1.15413791239721 | 0.145862087602786 |
| 30 | 1.3 | 1.43708634200711 | -0.137086342007114 |
| 31 | 1.2 | 1.65819168491358 | -0.458191684913577 |
| 32 | 1.4 | 1.48888916661375 | -0.0888891666137487 |
| 33 | 2.2 | 1.56782855085794 | 0.632171449142057 |
| 34 | 2.9 | 2.50304841636838 | 0.396951583631625 |
| 35 | 3.1 | 3.45533932885406 | -0.355339328854061 |
| 36 | 3.5 | 3.44768040245762 | 0.0523195975423788 |
| 37 | 3.6 | 3.83536220296386 | -0.235362202963864 |
| 38 | 4.4 | 3.59203413951563 | 0.807965860484374 |
| 39 | 4.1 | 4.46926557613056 | -0.369265576130564 |
| 40 | 5.1 | 4.06282392472653 | 1.03717607527347 |
| 41 | 5.8 | 5.16758492617124 | 0.632415073828764 |
| 42 | 5.9 | 5.4591786248849 | 0.440821375115102 |
| 43 | 5.4 | 5.91434180180047 | -0.514341801800468 |
| 44 | 5.5 | 5.04376950062371 | 0.456230499376291 |
| 45 | 4.8 | 4.86508476662655 | -0.0650847666265526 |
| 46 | 3.2 | 4.22099162339054 | -1.02099162339054 |
| 47 | 2.7 | 2.84862862666827 | -0.148628626668274 |
| 48 | 2.1 | 2.03095051601240 | 0.0690494839875975 |
| 49 | 1.9 | 1.61159505291420 | 0.288404947085805 |
| 50 | 0.6 | 1.49378785308508 | -0.893787853085084 |
| 51 | 0.7 | 0.317973436803132 | 0.382026563196868 |
| 52 | -0.2 | 0.466787836515665 | -0.666787836515665 |
| 53 | -1 | -0.377225346384058 | -0.622774653615942 |
| 54 | -1.7 | -1.22432228551193 | -0.475677714488072 |
| 55 | -0.7 | -1.77876816776782 | 1.07876816776782 |
| 56 | -1 | -0.777908501241377 | -0.222091498758623 |
| Goldfeld-Quandt test for Heteroskedasticity | |||
| p-values | Alternative Hypothesis | ||
| breakpoint index | greater | 2-sided | less |
| 21 | 0.385112939108984 | 0.770225878217968 | 0.614887060891016 |
| 22 | 0.238982298380870 | 0.477964596761741 | 0.76101770161913 |
| 23 | 0.131524843899220 | 0.263049687798441 | 0.86847515610078 |
| 24 | 0.072512960826465 | 0.14502592165293 | 0.927487039173535 |
| 25 | 0.033009243457306 | 0.066018486914612 | 0.966990756542694 |
| 26 | 0.0140635348849267 | 0.0281270697698534 | 0.985936465115073 |
| 27 | 0.00546772728398714 | 0.0109354545679743 | 0.994532272716013 |
| 28 | 0.00280841230546540 | 0.00561682461093079 | 0.997191587694535 |
| 29 | 0.000934217956680162 | 0.00186843591336032 | 0.99906578204332 |
| 30 | 0.000279459674841270 | 0.000558919349682541 | 0.999720540325159 |
| 31 | 0.000196752440627175 | 0.000393504881254349 | 0.999803247559373 |
| 32 | 0.000999882951486526 | 0.00199976590297305 | 0.999000117048513 |
| 33 | 0.0167651151639226 | 0.0335302303278452 | 0.983234884836077 |
| 34 | 0.00908276349618909 | 0.0181655269923782 | 0.99091723650381 |
| 35 | 0.00683473958062108 | 0.0136694791612422 | 0.993165260419379 |
| Meta Analysis of Goldfeld-Quandt test for Heteroskedasticity | |||
| Description | # significant tests | % significant tests | OK/NOK |
| 1% type I error level | 5 | 0.333333333333333 | NOK |
| 5% type I error level | 10 | 0.666666666666667 | NOK |
| 10% type I error level | 11 | 0.733333333333333 | NOK |