| Multiple Linear Regression - Estimated Regression Equation |
| y(t)[t] = -101.373072224221 -0.177026843225496`x(t)`[t] + 1.3382306133261`y(t-1)`[t] -0.612915876284746`y(t-2)`[t] + 0.435208040597549`y(t-3) `[t] + e[t] |
| Multiple Linear Regression - Ordinary Least Squares | |||||
| Variable | Parameter | S.D. | T-STAT H0: parameter = 0 | 2-tail p-value | 1-tail p-value |
| (Intercept) | -101.373072224221 | 72.088641 | -1.4062 | 0.165604 | 0.082802 |
| `x(t)` | -0.177026843225496 | 0.058496 | -3.0263 | 0.003844 | 0.001922 |
| `y(t-1)` | 1.3382306133261 | 0.129047 | 10.3701 | 0 | 0 |
| `y(t-2)` | -0.612915876284746 | 0.223408 | -2.7435 | 0.008322 | 0.004161 |
| `y(t-3) ` | 0.435208040597549 | 0.168438 | 2.5838 | 0.012622 | 0.006311 |
| Multiple Linear Regression - Regression Statistics | |
| Multiple R | 0.959219638099753 |
| R-squared | 0.920102314116222 |
| Adjusted R-squared | 0.913956338279008 |
| F-TEST (value) | 149.708091682533 |
| F-TEST (DF numerator) | 4 |
| F-TEST (DF denominator) | 52 |
| p-value | 0 |
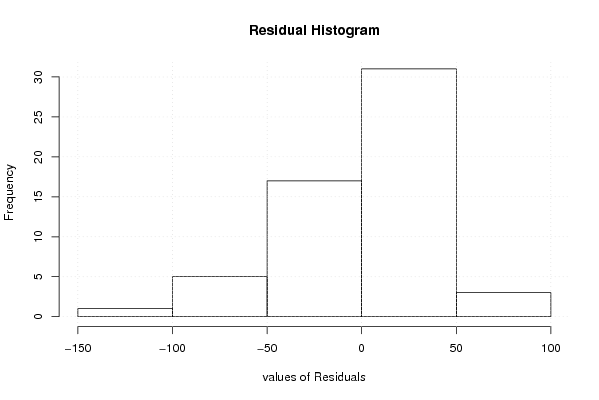
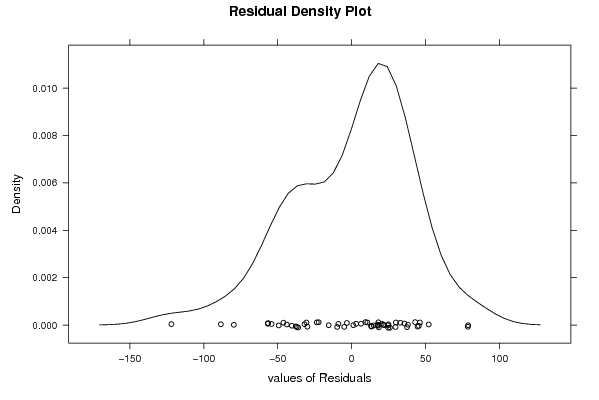
| Multiple Linear Regression - Residual Statistics | |
| Residual Standard Deviation | 41.9409779524104 |
| Sum Squared Residuals | 91470.3728434381 |
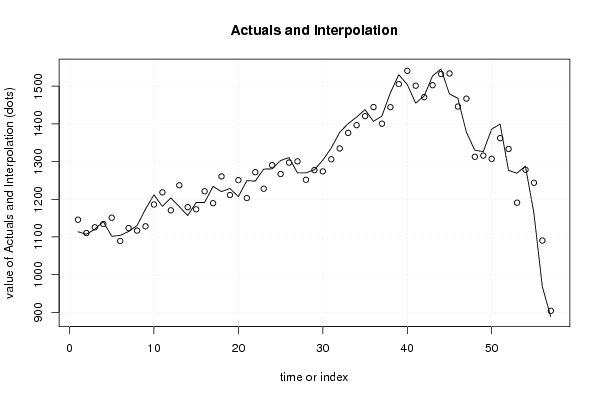
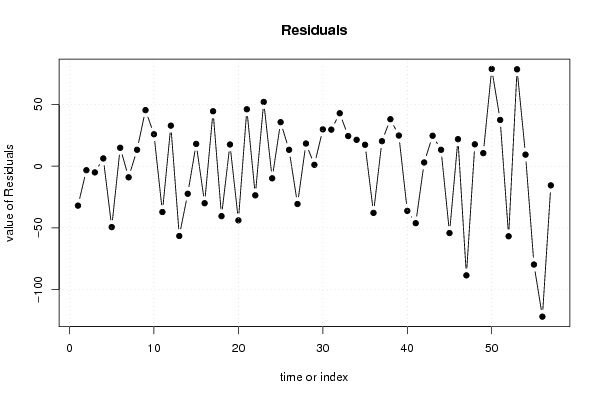
| Multiple Linear Regression - Actuals, Interpolation, and Residuals | |||
| Time or Index | Actuals | Interpolation Forecast | Residuals Prediction Error |
| 1 | 1113.89 | 1145.81495678853 | -31.9249567885287 |
| 2 | 1107.3 | 1110.53184080926 | -3.23184080926111 |
| 3 | 1120.68 | 1125.70085234954 | -5.02085234954376 |
| 4 | 1140.84 | 1134.55714834375 | 6.28285165624898 |
| 5 | 1101.72 | 1151.05123067882 | -49.3312306788211 |
| 6 | 1104.24 | 1089.30736508471 | 14.9326349152927 |
| 7 | 1114.58 | 1123.58083889729 | -9.00083889728846 |
| 8 | 1130.2 | 1116.90096160719 | 13.299038392814 |
| 9 | 1173.78 | 1128.35891036226 | 45.421089637744 |
| 10 | 1211.92 | 1186.04867940818 | 25.8713205918221 |
| 11 | 1181.27 | 1218.38850458217 | -37.1185045821748 |
| 12 | 1203.6 | 1170.73980428899 | 32.8601957110093 |
| 13 | 1180.59 | 1237.1224692734 | -56.5324692734011 |
| 14 | 1156.85 | 1179.17147476660 | -22.3214747665952 |
| 15 | 1191.5 | 1173.44495674857 | 18.0550432514313 |
| 16 | 1191.33 | 1221.29742034353 | -29.9674203435287 |
| 17 | 1234.18 | 1189.66872264328 | 44.511277356725 |
| 18 | 1220.33 | 1260.78869532633 | -40.4586953263295 |
| 19 | 1228.81 | 1211.22555932058 | 17.5844406794159 |
| 20 | 1207.01 | 1250.87968151303 | -43.8696815130265 |
| 21 | 1249.48 | 1203.35576570952 | 46.1242342904794 |
| 22 | 1248.29 | 1271.88748813718 | -23.5974881371836 |
| 23 | 1280.08 | 1228.00564440311 | 52.0743555968895 |
| 24 | 1280.66 | 1290.46875835061 | -9.80875835060577 |
| 25 | 1302.88 | 1267.21507814755 | 35.6649218524481 |
| 26 | 1310.61 | 1297.33034837932 | 13.2796516206778 |
| 27 | 1270.05 | 1300.68126726895 | -30.63126726895 |
| 28 | 1270.06 | 1251.69802155945 | 18.3619784405477 |
| 29 | 1278.53 | 1277.40394610339 | 1.12605389661077 |
| 30 | 1303.8 | 1273.94842697311 | 29.8515730268850 |
| 31 | 1335.83 | 1306.19866812410 | 29.6313318758990 |
| 32 | 1377.76 | 1334.87016019554 | 42.8898398044626 |
| 33 | 1400.63 | 1376.21420136304 | 24.4157986369630 |
| 34 | 1418.03 | 1396.65292792655 | 21.3770720734454 |
| 35 | 1437.9 | 1420.54882870609 | 17.3511712939099 |
| 36 | 1406.8 | 1444.62226883309 | -37.8222688330914 |
| 37 | 1420.83 | 1400.54815434846 | 20.2818456515413 |
| 38 | 1482.37 | 1444.31543532904 | 38.0545646709585 |
| 39 | 1530.63 | 1505.79285805317 | 24.8371419468284 |
| 40 | 1504.66 | 1540.84305864321 | -36.1830586432093 |
| 41 | 1455.18 | 1501.34529696852 | -46.1652969685213 |
| 42 | 1473.96 | 1470.94379379734 | 3.01620620266076 |
| 43 | 1527.29 | 1502.62009701246 | 24.6699029875432 |
| 44 | 1545.79 | 1532.49024985173 | 13.2997501482741 |
| 45 | 1479.63 | 1533.79608057777 | -54.1660805777681 |
| 46 | 1467.97 | 1446.06526659232 | 21.9047334076804 |
| 47 | 1378.6 | 1467.02553542766 | -88.425535427657 |
| 48 | 1330.45 | 1312.72537097837 | 17.7246290216308 |
| 49 | 1326.41 | 1315.82678751189 | 10.5832124881132 |
| 50 | 1385.97 | 1307.18937549104 | 78.7806245089571 |
| 51 | 1399.62 | 1362.17510758246 | 37.4448924175349 |
| 52 | 1276.69 | 1333.45987334998 | -56.7698733499768 |
| 53 | 1269.42 | 1190.93154432114 | 78.4884556788597 |
| 54 | 1287.83 | 1278.46561878920 | 9.36438121079896 |
| 55 | 1164.17 | 1243.83491817420 | -79.6649181741952 |
| 56 | 968.67 | 1090.54411669818 | -121.874116698181 |
| 57 | 888.61 | 904.139587185264 | -15.5295871852643 |
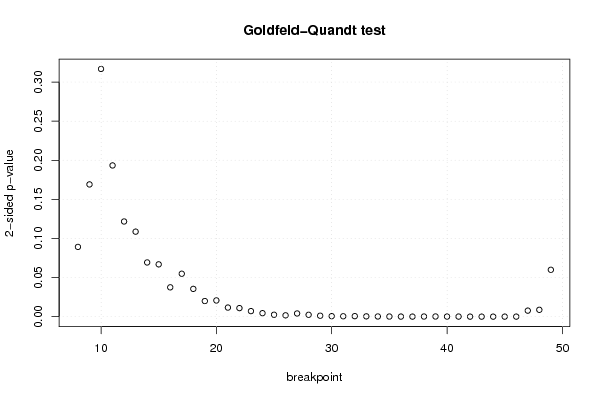
| Goldfeld-Quandt test for Heteroskedasticity | |||
| p-values | Alternative Hypothesis | ||
| breakpoint index | greater | 2-sided | less |
| 8 | 0.0445986528287035 | 0.089197305657407 | 0.955401347171297 |
| 9 | 0.084580506012258 | 0.169161012024516 | 0.915419493987742 |
| 10 | 0.158414729384387 | 0.316829458768774 | 0.841585270615613 |
| 11 | 0.0967154129371502 | 0.193430825874300 | 0.90328458706285 |
| 12 | 0.0608730427603036 | 0.121746085520607 | 0.939126957239696 |
| 13 | 0.0543667989265295 | 0.108733597853059 | 0.94563320107347 |
| 14 | 0.0346827313214778 | 0.0693654626429556 | 0.965317268678522 |
| 15 | 0.0334570271776749 | 0.0669140543553498 | 0.966542972822325 |
| 16 | 0.0187628903601131 | 0.0375257807202263 | 0.981237109639887 |
| 17 | 0.0274519945333828 | 0.0549039890667657 | 0.972548005466617 |
| 18 | 0.0177709441763800 | 0.0355418883527600 | 0.98222905582362 |
| 19 | 0.0099978466771729 | 0.0199956933543458 | 0.990002153322827 |
| 20 | 0.0103860922827398 | 0.0207721845654795 | 0.98961390771726 |
| 21 | 0.00582195172063677 | 0.0116439034412735 | 0.994178048279363 |
| 22 | 0.00547316447677123 | 0.0109463289535425 | 0.994526835523229 |
| 23 | 0.00357104401816051 | 0.00714208803632101 | 0.99642895598184 |
| 24 | 0.00223410998223719 | 0.00446821996447439 | 0.997765890017763 |
| 25 | 0.00122771499366293 | 0.00245542998732587 | 0.998772285006337 |
| 26 | 0.000866805853335414 | 0.00173361170667083 | 0.999133194146665 |
| 27 | 0.00204936135074388 | 0.00409872270148776 | 0.997950638649256 |
| 28 | 0.00121102478707346 | 0.00242204957414691 | 0.998788975212927 |
| 29 | 0.000594516452072362 | 0.00118903290414472 | 0.999405483547928 |
| 30 | 0.000329683094161596 | 0.000659366188323191 | 0.999670316905838 |
| 31 | 0.000258127969070384 | 0.000516255938140768 | 0.99974187203093 |
| 32 | 0.000333716391374584 | 0.000667432782749167 | 0.999666283608625 |
| 33 | 0.000208041966988373 | 0.000416083933976746 | 0.999791958033012 |
| 34 | 0.000131614926840773 | 0.000263229853681546 | 0.99986838507316 |
| 35 | 7.7202454236211e-05 | 0.000154404908472422 | 0.999922797545764 |
| 36 | 6.02962903802461e-05 | 0.000120592580760492 | 0.99993970370962 |
| 37 | 3.60929004935715e-05 | 7.21858009871429e-05 | 0.999963907099506 |
| 38 | 9.20159590040587e-05 | 0.000184031918008117 | 0.999907984040996 |
| 39 | 0.000125260571239683 | 0.000250521142479367 | 0.99987473942876 |
| 40 | 7.3670977332184e-05 | 0.000147341954664368 | 0.999926329022668 |
| 41 | 6.25149243998892e-05 | 0.000125029848799778 | 0.9999374850756 |
| 42 | 2.85421327235316e-05 | 5.70842654470632e-05 | 0.999971457867276 |
| 43 | 1.90374975874115e-05 | 3.8074995174823e-05 | 0.999980962502413 |
| 44 | 1.29328582321173e-05 | 2.58657164642346e-05 | 0.999987067141768 |
| 45 | 2.25302528999468e-05 | 4.50605057998935e-05 | 0.9999774697471 |
| 46 | 3.05063263711419e-05 | 6.10126527422838e-05 | 0.999969493673629 |
| 47 | 0.00385735133915445 | 0.0077147026783089 | 0.996142648660846 |
| 48 | 0.00438775482962213 | 0.00877550965924427 | 0.995612245170378 |
| 49 | 0.0299819039945489 | 0.0599638079890977 | 0.97001809600545 |
| Meta Analysis of Goldfeld-Quandt test for Heteroskedasticity | |||
| Description | # significant tests | % significant tests | OK/NOK |
| 1% type I error level | 26 | 0.619047619047619 | NOK |
| 5% type I error level | 32 | 0.761904761904762 | NOK |
| 10% type I error level | 37 | 0.880952380952381 | NOK |