| Multiple Linear Regression - Estimated Regression Equation |
| Y[t] = + 23742.1551966182 + 6615.98887332214X[t] + 0.902769444396003Y1[t] + 0.187257523728878Y2[t] + 0.0782568056750277Y3[t] -0.261594494752365Y4[t] -4817.45387065382M1[t] -9797.82497078342M2[t] -7592.9204932169M3[t] -10990.3561951020M4[t] -7520.4387858831M5[t] + 15571.2127480332M6[t] -1051.92432274379M7[t] -10008.0686935439M8[t] -15844.4644416581M9[t] -10334.1572687118M10[t] -1324.53698797528M11[t] + 144.895467430072t + e[t] |
| Multiple Linear Regression - Ordinary Least Squares | |||||
| Variable | Parameter | S.D. | T-STAT H0: parameter = 0 | 2-tail p-value | 1-tail p-value |
| (Intercept) | 23742.1551966182 | 12205.578893 | 1.9452 | 0.059179 | 0.029589 |
| X | 6615.98887332214 | 2553.85907 | 2.5906 | 0.013514 | 0.006757 |
| Y1 | 0.902769444396003 | 0.147766 | 6.1095 | 0 | 0 |
| Y2 | 0.187257523728878 | 0.206373 | 0.9074 | 0.369928 | 0.184964 |
| Y3 | 0.0782568056750277 | 0.20625 | 0.3794 | 0.706483 | 0.353241 |
| Y4 | -0.261594494752365 | 0.162849 | -1.6064 | 0.116474 | 0.058237 |
| M1 | -4817.45387065382 | 2604.005125 | -1.85 | 0.072099 | 0.036049 |
| M2 | -9797.82497078342 | 2998.209807 | -3.2679 | 0.002303 | 0.001152 |
| M3 | -7592.9204932169 | 2926.792723 | -2.5943 | 0.013392 | 0.006696 |
| M4 | -10990.3561951020 | 2565.546722 | -4.2838 | 0.000121 | 6e-05 |
| M5 | -7520.4387858831 | 2775.472514 | -2.7096 | 0.010049 | 0.005025 |
| M6 | 15571.2127480332 | 2595.664252 | 5.9989 | 1e-06 | 0 |
| M7 | -1051.92432274379 | 3485.975333 | -0.3018 | 0.764481 | 0.382241 |
| M8 | -10008.0686935439 | 4463.886007 | -2.242 | 0.030877 | 0.015439 |
| M9 | -15844.4644416581 | 5372.774649 | -2.949 | 0.005429 | 0.002714 |
| M10 | -10334.1572687118 | 3144.926122 | -3.286 | 0.002191 | 0.001096 |
| M11 | -1324.53698797528 | 2822.16277 | -0.4693 | 0.641513 | 0.320756 |
| t | 144.895467430072 | 82.529097 | 1.7557 | 0.0872 | 0.0436 |
| Multiple Linear Regression - Regression Statistics | |
| Multiple R | 0.987881224556706 |
| R-squared | 0.975909313831657 |
| Adjusted R-squared | 0.96513190159845 |
| F-TEST (value) | 90.5513580360972 |
| F-TEST (DF numerator) | 17 |
| F-TEST (DF denominator) | 38 |
| p-value | 0 |
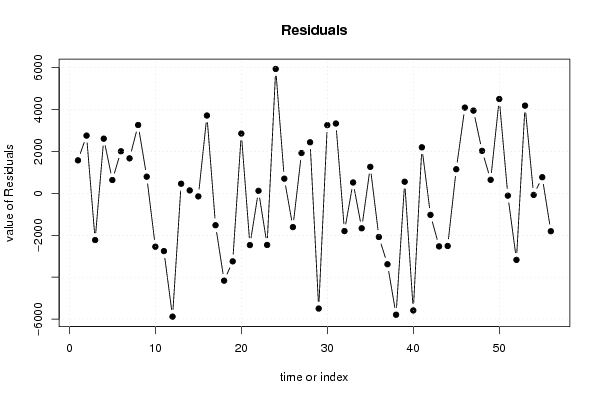
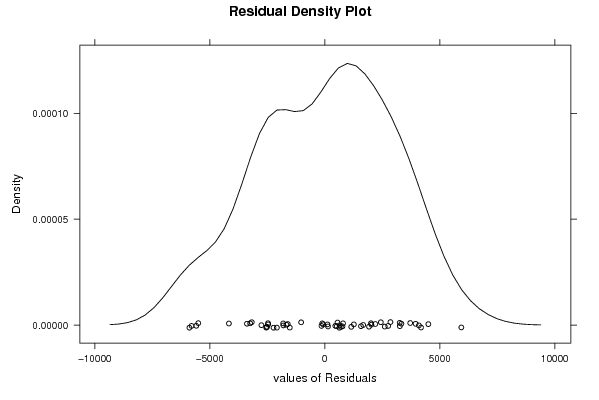
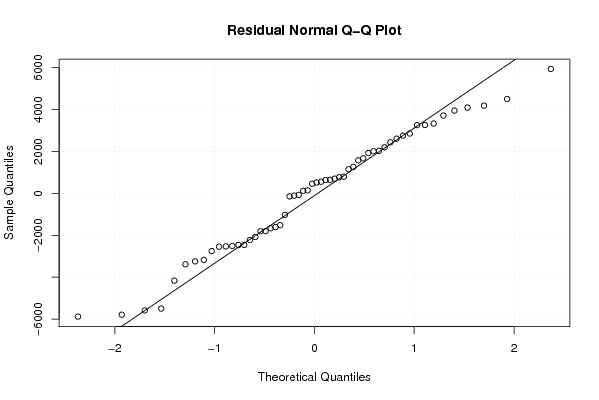
| Multiple Linear Regression - Residual Statistics | |
| Residual Standard Deviation | 3444.73750487735 |
| Sum Squared Residuals | 450916226.145328 |
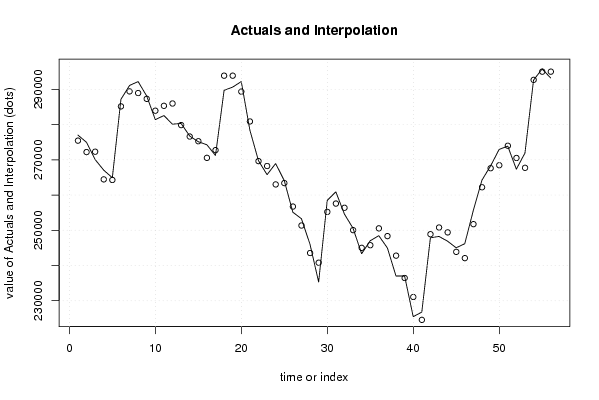
| Multiple Linear Regression - Actuals, Interpolation, and Residuals | |||
| Time or Index | Actuals | Interpolation Forecast | Residuals Prediction Error |
| 1 | 277026 | 275450.547694024 | 1575.45230597623 |
| 2 | 274960 | 272203.66352556 | 2756.33647443986 |
| 3 | 270073 | 272300.834214719 | -2227.83421471922 |
| 4 | 267063 | 264453.504108705 | 2609.49589129474 |
| 5 | 264916 | 264280.714741103 | 635.285258896512 |
| 6 | 287182 | 285173.383815732 | 2008.61618426771 |
| 7 | 291109 | 289437.024068634 | 1671.97593136619 |
| 8 | 292223 | 288959.808864174 | 3263.19113582563 |
| 9 | 288109 | 287313.463455624 | 795.536544375801 |
| 10 | 281400 | 283945.928938919 | -2545.92893891904 |
| 11 | 282579 | 285333.283532642 | -2754.28353264171 |
| 12 | 280113 | 285997.405670592 | -5884.4056705917 |
| 13 | 280331 | 279870.569280101 | 460.430719898766 |
| 14 | 276759 | 276617.422571949 | 141.577428050907 |
| 15 | 275139 | 275281.951009628 | -142.951009628418 |
| 16 | 274275 | 270560.192408189 | 3714.80759181126 |
| 17 | 271234 | 272755.094386712 | -1521.09438671162 |
| 18 | 289725 | 293892.16851721 | -4167.16851720995 |
| 19 | 290649 | 293893.755781926 | -3244.75578192557 |
| 20 | 292223 | 289367.283413856 | 2855.71658614362 |
| 21 | 278429 | 280896.334769534 | -2467.33476953379 |
| 22 | 269749 | 269628.644522239 | 120.355477761316 |
| 23 | 265784 | 268245.554109713 | -2461.55410971316 |
| 24 | 268957 | 263018.8862999 | 5938.11370009986 |
| 25 | 264099 | 263397.504649515 | 701.495350485206 |
| 26 | 255121 | 256730.89515868 | -1609.89515868026 |
| 27 | 253276 | 251351.464997715 | 1924.53500228535 |
| 28 | 245980 | 243541.906196493 | 2438.09380350746 |
| 29 | 235295 | 240792.859529705 | -5497.85952970512 |
| 30 | 258479 | 255221.295691971 | 3257.70430802932 |
| 31 | 260916 | 257583.694435071 | 3332.30556492931 |
| 32 | 254586 | 256386.292562900 | -1800.29256289958 |
| 33 | 250566 | 250046.051243715 | 519.948756285099 |
| 34 | 243345 | 245012.685661507 | -1667.68566150673 |
| 35 | 247028 | 245762.656642665 | 1265.34335733471 |
| 36 | 248464 | 250546.103175904 | -2082.10317590375 |
| 37 | 244962 | 248346.108629851 | -3384.10862985125 |
| 38 | 237003 | 242795.229868860 | -5792.22986885955 |
| 39 | 237008 | 236453.036206586 | 554.963793413793 |
| 40 | 225477 | 231064.922160057 | -5587.92216005662 |
| 41 | 226762 | 224564.094865249 | 2197.90513475080 |
| 42 | 247857 | 248883.855964289 | -1026.85596428925 |
| 43 | 248256 | 250786.474509755 | -2530.47450975508 |
| 44 | 246892 | 249402.634192042 | -2510.63419204164 |
| 45 | 245021 | 243869.150531127 | 1151.84946887290 |
| 46 | 246186 | 242092.740877336 | 4093.25912266446 |
| 47 | 255688 | 251737.50571498 | 3950.49428502015 |
| 48 | 264242 | 262213.604853604 | 2028.39514639559 |
| 49 | 268270 | 267623.269746509 | 646.73025349105 |
| 50 | 272969 | 268464.788874951 | 4504.21112504904 |
| 51 | 273886 | 273994.713571351 | -108.713571351506 |
| 52 | 267353 | 270527.475126557 | -3174.47512655684 |
| 53 | 271916 | 267730.236477231 | 4185.76352276943 |
| 54 | 292633 | 292705.296010798 | -72.296010797836 |
| 55 | 295804 | 295033.051204615 | 770.948795385147 |
| 56 | 293222 | 295029.980967028 | -1807.98096702804 |
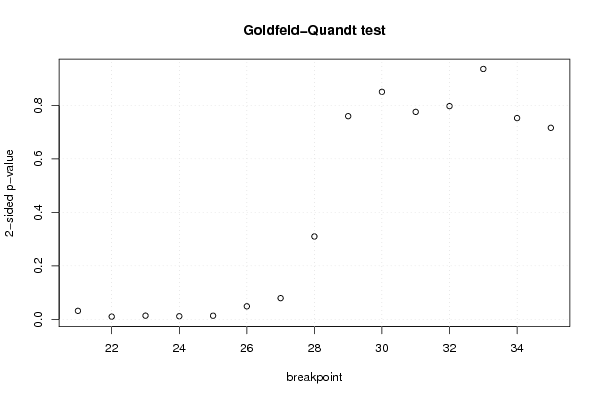
| Goldfeld-Quandt test for Heteroskedasticity | |||
| p-values | Alternative Hypothesis | ||
| breakpoint index | greater | 2-sided | less |
| 21 | 0.0159090960208824 | 0.0318181920417649 | 0.984090903979118 |
| 22 | 0.00507123410633958 | 0.0101424682126792 | 0.99492876589366 |
| 23 | 0.00691439417928566 | 0.0138287883585713 | 0.993085605820714 |
| 24 | 0.00581956533953463 | 0.0116391306790693 | 0.994180434660465 |
| 25 | 0.00679766566135662 | 0.0135953313227132 | 0.993202334338643 |
| 26 | 0.0243805013900334 | 0.0487610027800668 | 0.975619498609967 |
| 27 | 0.039658552566596 | 0.079317105133192 | 0.960341447433404 |
| 28 | 0.154894411149358 | 0.309788822298717 | 0.845105588850642 |
| 29 | 0.379746894393111 | 0.759493788786223 | 0.620253105606889 |
| 30 | 0.425199915033964 | 0.850399830067927 | 0.574800084966036 |
| 31 | 0.612230812247546 | 0.775538375504908 | 0.387769187752454 |
| 32 | 0.601476233291617 | 0.797047533416766 | 0.398523766708383 |
| 33 | 0.531993929152655 | 0.936012141694691 | 0.468006070847345 |
| 34 | 0.376202130715717 | 0.752404261431435 | 0.623797869284283 |
| 35 | 0.358006088671413 | 0.716012177342825 | 0.641993911328587 |
| Meta Analysis of Goldfeld-Quandt test for Heteroskedasticity | |||
| Description | # significant tests | % significant tests | OK/NOK |
| 1% type I error level | 0 | 0 | OK |
| 5% type I error level | 6 | 0.4 | NOK |
| 10% type I error level | 7 | 0.466666666666667 | NOK |