| Multiple Linear Regression - Estimated Regression Equation |
| Y[t] = + 9690.06414062205 + 8887.14053601723X[t] + 0.928450603723507Y1[t] + 0.00697821046662423Y2[t] -293.055756716993M1[t] -3225.60445747154M2[t] -6294.3963344095M3[t] -4703.55564690838M4[t] -9394.0620252704M5[t] -6208.55988822182M6[t] + 16596.0512996447M7[t] -1103.97720103963M8[t] -5033.72634393642M9[t] -7293.7916697285M10[t] -7370.59193338102M11[t] + 248.332473555430t + e[t] |
| Multiple Linear Regression - Ordinary Least Squares | |||||
| Variable | Parameter | S.D. | T-STAT H0: parameter = 0 | 2-tail p-value | 1-tail p-value |
| (Intercept) | 9690.06414062205 | 10137.93728 | 0.9558 | 0.344764 | 0.172382 |
| X | 8887.14053601723 | 2265.832236 | 3.9222 | 0.000327 | 0.000164 |
| Y1 | 0.928450603723507 | 0.148114 | 6.2685 | 0 | 0 |
| Y2 | 0.00697821046662423 | 0.148656 | 0.0469 | 0.962787 | 0.481394 |
| M1 | -293.055756716993 | 2607.516637 | -0.1124 | 0.911064 | 0.455532 |
| M2 | -3225.60445747154 | 2570.643895 | -1.2548 | 0.216663 | 0.108331 |
| M3 | -6294.3963344095 | 2420.166044 | -2.6008 | 0.012877 | 0.006438 |
| M4 | -4703.55564690838 | 2348.260993 | -2.003 | 0.051819 | 0.02591 |
| M5 | -9394.0620252704 | 2394.298419 | -3.9235 | 0.000326 | 0.000163 |
| M6 | -6208.55988822182 | 2375.438718 | -2.6136 | 0.01247 | 0.006235 |
| M7 | 16596.0512996447 | 2418.689014 | 6.8616 | 0 | 0 |
| M8 | -1103.97720103963 | 4390.783027 | -0.2514 | 0.802737 | 0.401369 |
| M9 | -5033.72634393642 | 2547.754411 | -1.9758 | 0.054939 | 0.02747 |
| M10 | -7293.7916697285 | 2573.647354 | -2.834 | 0.007101 | 0.003551 |
| M11 | -7370.59193338102 | 2469.135564 | -2.9851 | 0.004763 | 0.002382 |
| t | 248.332473555430 | 62.860902 | 3.9505 | 3e-04 | 0.00015 |
| Multiple Linear Regression - Regression Statistics | |
| Multiple R | 0.98676705339317 |
| R-squared | 0.97370921766224 |
| Adjusted R-squared | 0.964090638758182 |
| F-TEST (value) | 101.232128714086 |
| F-TEST (DF numerator) | 15 |
| F-TEST (DF denominator) | 41 |
| p-value | 0 |
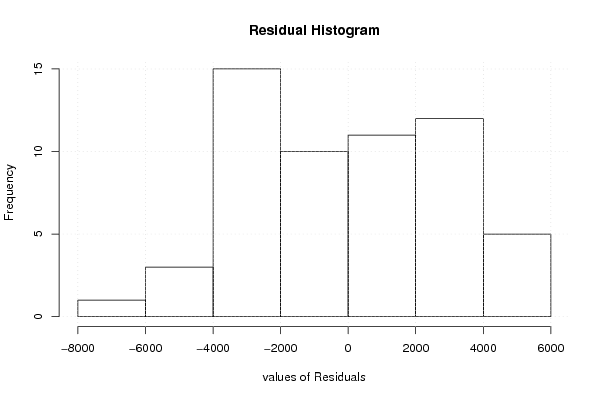
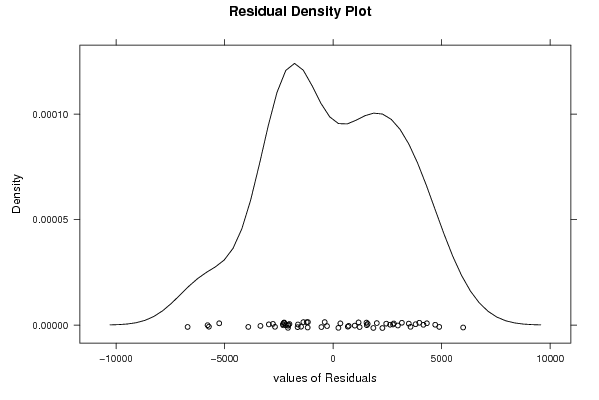
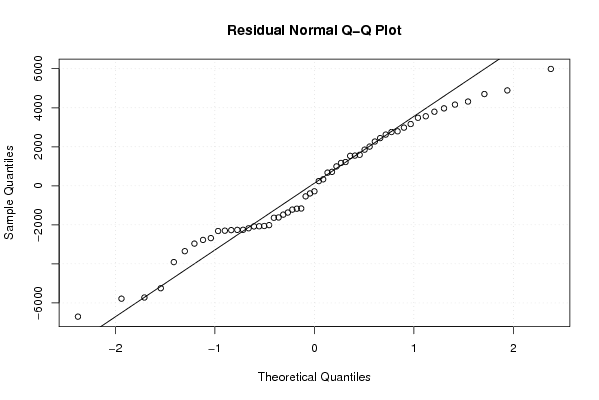
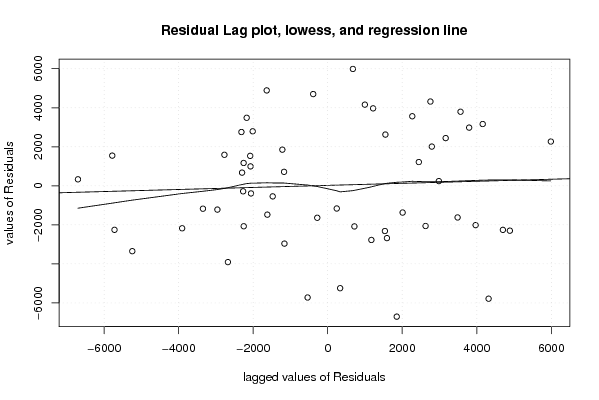
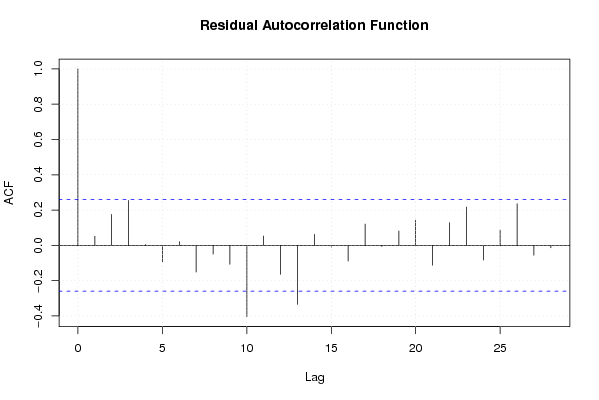
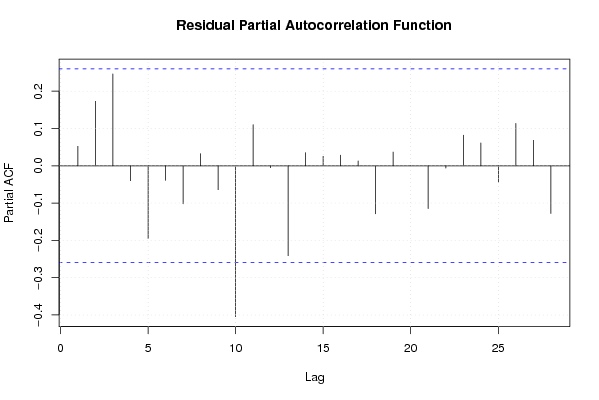
| Multiple Linear Regression - Residual Statistics | |
| Residual Standard Deviation | 3476.52994540491 |
| Sum Squared Residuals | 495536678.91318 |
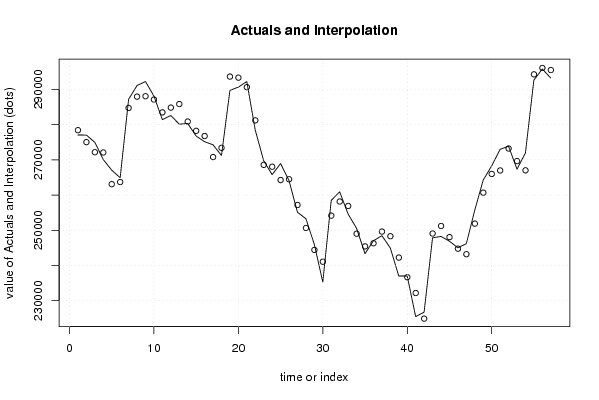
| Multiple Linear Regression - Actuals, Interpolation, and Residuals | |||
| Time or Index | Actuals | Interpolation Forecast | Residuals Prediction Error |
| 1 | 277051 | 278421.583027982 | -1370.58302798227 |
| 2 | 277026 | 275015.245418106 | 2010.75458189406 |
| 3 | 274960 | 272166.082897993 | 2793.91710200691 |
| 4 | 270073 | 272086.902656495 | -2013.90265649525 |
| 5 | 267063 | 263092.973668468 | 3970.02633153218 |
| 6 | 264916 | 263698.069447314 | 1217.93055268632 |
| 7 | 287182 | 284736.625249037 | 2445.37475096334 |
| 8 | 291109 | 287942.828146544 | 3166.17185345640 |
| 9 | 292223 | 288062.813832274 | 4160.18616772568 |
| 10 | 288109 | 287112.778385088 | 996.221614911926 |
| 11 | 281400 | 283472.438537732 | -2072.43853773232 |
| 12 | 282579 | 284833.679486428 | -2254.67948642805 |
| 13 | 280113 | 285836.782651036 | -5723.78265103592 |
| 14 | 280331 | 280871.234545195 | -540.234545194788 |
| 15 | 276759 | 278235.969106413 | -1476.96910641328 |
| 16 | 275139 | 276760.237960851 | -1621.23796085119 |
| 17 | 274275 | 270789.047910226 | 3485.95208977426 |
| 18 | 271234 | 273409.396498257 | -2175.3964982567 |
| 19 | 289725 | 293632.892699912 | -3907.89269991223 |
| 20 | 290649 | 293327.956048206 | -2678.95604820578 |
| 21 | 292223 | 290633.461826443 | 1589.53817355670 |
| 22 | 278429 | 281202.417554921 | -2773.41755492139 |
| 23 | 269749 | 268577.885840337 | 1171.11415966330 |
| 24 | 265784 | 268041.601571776 | -2257.6015717765 |
| 25 | 268957 | 264255.000778001 | 4701.99922199908 |
| 26 | 264099 | 264489.089711916 | -390.089711916333 |
| 27 | 255121 | 257180.359137456 | -2059.35913745561 |
| 28 | 253276 | 250650.002631836 | 2625.99736816436 |
| 29 | 245980 | 244432.18698959 | 1547.81301041018 |
| 30 | 235295 | 241079.171197116 | -5784.1711971162 |
| 31 | 258479 | 254160.707134188 | 4318.29286581208 |
| 32 | 260916 | 258159.647724949 | 2756.352275051 |
| 33 | 254586 | 256902.64800834 | -2316.64800834005 |
| 34 | 250566 | 249030.828733441 | 1535.17126655924 |
| 35 | 243345 | 245425.817444121 | -2080.81744412143 |
| 36 | 247028 | 246312.347635495 | 715.652364505387 |
| 37 | 248464 | 249636.718268067 | -1172.71826806723 |
| 38 | 244962 | 248311.457856964 | -3349.45785696365 |
| 39 | 237003 | 242249.585149571 | -5246.58514957147 |
| 40 | 237008 | 236674.782262539 | 333.217737461498 |
| 41 | 225477 | 232181.711033647 | -6704.71103364666 |
| 42 | 226762 | 224909.616623767 | 1852.38337623276 |
| 43 | 247857 | 249075.153566083 | -1218.15356608320 |
| 44 | 248256 | 251218.090024951 | -2962.09002495136 |
| 45 | 246892 | 248054.330496289 | -1162.33049628913 |
| 46 | 245021 | 244778.97532655 | 242.024673450216 |
| 47 | 246186 | 243203.858177810 | 2982.14182219046 |
| 48 | 255688 | 251891.371306301 | 3796.62869369917 |
| 49 | 264242 | 260676.915274914 | 3565.08472508635 |
| 50 | 268270 | 266000.972467819 | 2269.02753218071 |
| 51 | 272969 | 266980.003708567 | 5988.99629143345 |
| 52 | 273886 | 273210.074488279 | 675.925511720576 |
| 53 | 267353 | 269652.08039807 | -2299.08039806996 |
| 54 | 271916 | 267026.746233546 | 4889.25376645381 |
| 55 | 292633 | 294270.62135078 | -1637.62135077999 |
| 56 | 295804 | 296085.47805535 | -281.478055350261 |
| 57 | 293222 | 295492.745836653 | -2270.74583665321 |
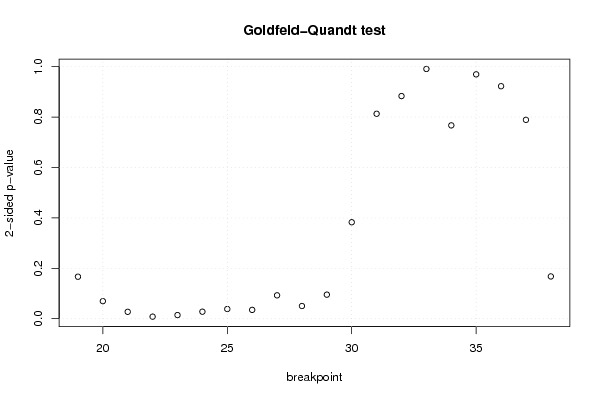
| Goldfeld-Quandt test for Heteroskedasticity | |||
| p-values | Alternative Hypothesis | ||
| breakpoint index | greater | 2-sided | less |
| 19 | 0.0833254008830628 | 0.166650801766126 | 0.916674599116937 |
| 20 | 0.034848733241147 | 0.069697466482294 | 0.965151266758853 |
| 21 | 0.0137149034846943 | 0.0274298069693886 | 0.986285096515306 |
| 22 | 0.00411816034350669 | 0.00823632068701338 | 0.995881839656493 |
| 23 | 0.00724274021581504 | 0.0144854804316301 | 0.992757259784185 |
| 24 | 0.0139680217011936 | 0.0279360434023872 | 0.986031978298806 |
| 25 | 0.0192445653618458 | 0.0384891307236916 | 0.980755434638154 |
| 26 | 0.0175481131990219 | 0.0350962263980439 | 0.982451886800978 |
| 27 | 0.0464164804442520 | 0.0928329608885039 | 0.953583519555748 |
| 28 | 0.0252352531868923 | 0.0504705063737846 | 0.974764746813108 |
| 29 | 0.0477426805230214 | 0.0954853610460427 | 0.952257319476979 |
| 30 | 0.191333385215373 | 0.382666770430746 | 0.808666614784627 |
| 31 | 0.406493444786295 | 0.81298688957259 | 0.593506555213705 |
| 32 | 0.441611110255308 | 0.883222220510615 | 0.558388889744692 |
| 33 | 0.495378492365108 | 0.990756984730216 | 0.504621507634892 |
| 34 | 0.616527167709834 | 0.766945664580333 | 0.383472832290166 |
| 35 | 0.515326343686595 | 0.96934731262681 | 0.484673656313405 |
| 36 | 0.538852301972627 | 0.922295396054745 | 0.461147698027373 |
| 37 | 0.60556961575371 | 0.78886076849258 | 0.39443038424629 |
| 38 | 0.916108967322827 | 0.167782065354347 | 0.0838910326771735 |
| Meta Analysis of Goldfeld-Quandt test for Heteroskedasticity | |||
| Description | # significant tests | % significant tests | OK/NOK |
| 1% type I error level | 1 | 0.05 | NOK |
| 5% type I error level | 6 | 0.3 | NOK |
| 10% type I error level | 10 | 0.5 | NOK |