| Multiple Linear Regression - Estimated Regression Equation |
| Y[t] = + 249.743765932925 -1.05055721843048X[t] -31.0307064944671M1[t] -38.0107916100911M2[t] -30.2152583601200M3[t] -16.6075935557811M4[t] -42.9485044503155M5[t] -78.6002454534487M6[t] + 24.2010437160465M7[t] + 12.2490607972814M8[t] + 32.1316138906316M9[t] + 12.4128437972922M10[t] -9.69543105311223M11[t] -0.393724067173589t + e[t] |
| Multiple Linear Regression - Ordinary Least Squares | |||||
| Variable | Parameter | S.D. | T-STAT H0: parameter = 0 | 2-tail p-value | 1-tail p-value |
| (Intercept) | 249.743765932925 | 32.897048 | 7.5917 | 0 | 0 |
| X | -1.05055721843048 | 0.345681 | -3.0391 | 0.003905 | 0.001953 |
| M1 | -31.0307064944671 | 8.026298 | -3.8661 | 0.000345 | 0.000173 |
| M2 | -38.0107916100911 | 8.400072 | -4.5251 | 4.2e-05 | 2.1e-05 |
| M3 | -30.2152583601200 | 8.108226 | -3.7265 | 0.00053 | 0.000265 |
| M4 | -16.6075935557811 | 7.725342 | -2.1498 | 0.036867 | 0.018434 |
| M5 | -42.9485044503155 | 7.565939 | -5.6766 | 1e-06 | 0 |
| M6 | -78.6002454534487 | 7.604837 | -10.3356 | 0 | 0 |
| M7 | 24.2010437160465 | 7.729548 | 3.131 | 0.003025 | 0.001513 |
| M8 | 12.2490607972814 | 7.743595 | 1.5818 | 0.12054 | 0.06027 |
| M9 | 32.1316138906316 | 7.636866 | 4.2074 | 0.000118 | 5.9e-05 |
| M10 | 12.4128437972922 | 7.547214 | 1.6447 | 0.106851 | 0.053426 |
| M11 | -9.69543105311223 | 7.527508 | -1.288 | 0.204188 | 0.102094 |
| t | -0.393724067173589 | 0.174624 | -2.2547 | 0.028956 | 0.014478 |
| Multiple Linear Regression - Regression Statistics | |
| Multiple R | 0.95098585591368 |
| R-squared | 0.904374098147874 |
| Adjusted R-squared | 0.877349386754882 |
| F-TEST (value) | 33.4647088361652 |
| F-TEST (DF numerator) | 13 |
| F-TEST (DF denominator) | 46 |
| p-value | 0 |
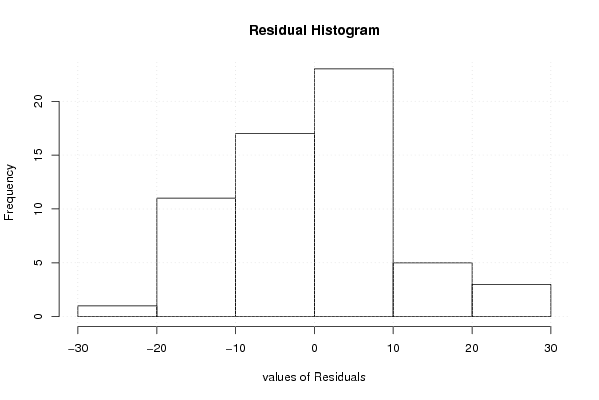
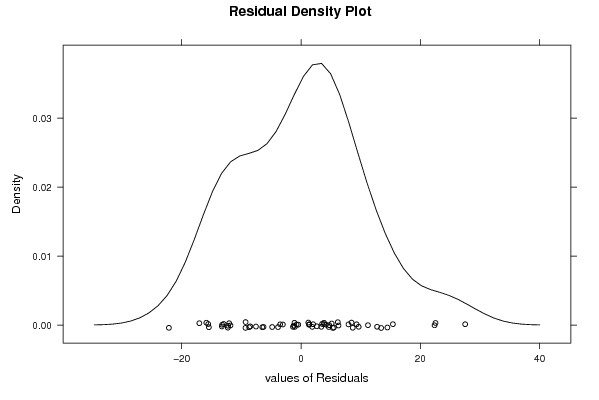
| Multiple Linear Regression - Residual Statistics | |
| Residual Standard Deviation | 11.8962863267016 |
| Sum Squared Residuals | 6509.99490487596 |
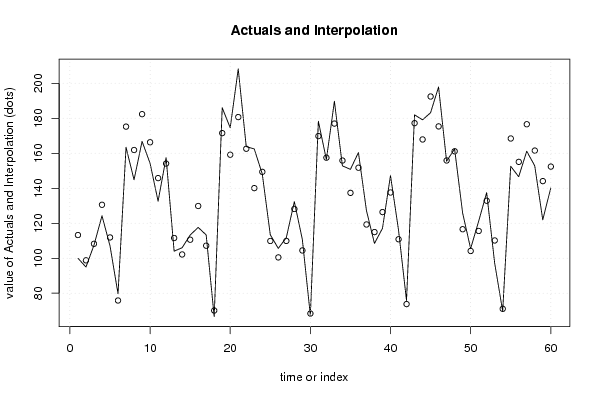
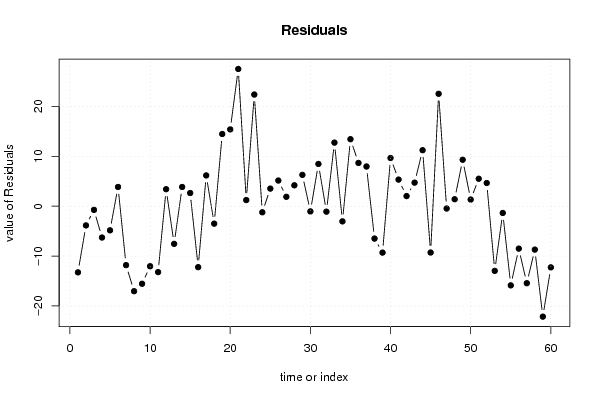
| Multiple Linear Regression - Actuals, Interpolation, and Residuals | |||
| Time or Index | Actuals | Interpolation Forecast | Residuals Prediction Error |
| 1 | 100 | 113.263613528237 | -13.2636135282369 |
| 2 | 94.97 | 98.8195542654022 | -3.84955426540225 |
| 3 | 107.5 | 108.238433307586 | -0.738433307586283 |
| 4 | 124.27 | 130.550199556360 | -6.28019955635957 |
| 5 | 107.06 | 111.894349604382 | -4.83434960438187 |
| 6 | 79.71 | 75.8488845340751 | 3.86111546592492 |
| 7 | 163.41 | 175.220339275133 | -11.8103392751326 |
| 8 | 144.83 | 161.866097359501 | -17.0360973595007 |
| 9 | 166.82 | 182.363461315371 | -15.5434613153706 |
| 10 | 154.26 | 166.295612445815 | -12.0356124458149 |
| 11 | 132.6 | 145.810683387623 | -13.2106833876234 |
| 12 | 157.51 | 154.103855443869 | 3.40614455613121 |
| 13 | 104.02 | 111.564529511234 | -7.54452951123358 |
| 14 | 106.03 | 102.173650469050 | 3.85634953095046 |
| 15 | 113.23 | 110.583994581540 | 2.64600541845966 |
| 16 | 117.64 | 129.859650469050 | -12.2196504690495 |
| 17 | 113.34 | 107.169660798299 | 6.17033920170123 |
| 18 | 66.62 | 70.1156607982988 | -3.49566079829877 |
| 19 | 185.99 | 171.514690970927 | 14.4753090290729 |
| 20 | 174.57 | 159.168983984988 | 15.4010160150115 |
| 21 | 208.19 | 180.674882870552 | 27.5151171294484 |
| 22 | 163.81 | 162.579458569425 | 1.23054143057496 |
| 23 | 162.46 | 140.077459651847 | 22.3825403481529 |
| 24 | 148.16 | 149.379166637786 | -1.21916663778571 |
| 25 | 113.41 | 109.875951066415 | 3.53404893358541 |
| 26 | 105.63 | 100.485072024231 | 5.14492797576945 |
| 27 | 111.79 | 109.903951066415 | 1.88604893358541 |
| 28 | 132.36 | 128.171072024231 | 4.18892797576947 |
| 29 | 110.75 | 104.462041851602 | 6.2879581483978 |
| 30 | 67.37 | 68.4165767812954 | -1.04657678129545 |
| 31 | 178.29 | 169.815606953924 | 8.47439304607619 |
| 32 | 156.38 | 157.469899967985 | -1.08989996798516 |
| 33 | 189.71 | 176.958728994162 | 12.7512710058382 |
| 34 | 152.8 | 155.837699903955 | -3.03769990395546 |
| 35 | 150.8 | 137.369840705150 | 13.4301592948495 |
| 36 | 160.4 | 151.724727911740 | 8.67527208826026 |
| 37 | 127.25 | 119.291762420406 | 7.95823757959424 |
| 38 | 108.47 | 114.954063598872 | -6.4840635988723 |
| 39 | 117.09 | 126.390012500443 | -9.30001250044287 |
| 40 | 147.25 | 137.586883378222 | 9.66311662177829 |
| 41 | 116.19 | 110.852248416514 | 5.3377515834864 |
| 42 | 75.83 | 73.7982484165136 | 2.03175158348638 |
| 43 | 181.94 | 177.214348448528 | 4.72565155147154 |
| 44 | 179.12 | 167.894246251670 | 11.2257537483304 |
| 45 | 183.15 | 192.436255498497 | -9.28625549849678 |
| 46 | 197.9 | 175.359871699248 | 22.5401283007522 |
| 47 | 155.42 | 155.883477570750 | -0.463477570749624 |
| 48 | 162.54 | 161.140539265731 | 1.39946073426907 |
| 49 | 125.9 | 116.584143473709 | 9.3158565262908 |
| 50 | 105.5 | 104.167659642445 | 1.33234035755463 |
| 51 | 121.11 | 115.603608544016 | 5.50639145598406 |
| 52 | 137.51 | 132.862194572139 | 4.64780542786135 |
| 53 | 97.2 | 110.161699329204 | -12.9616993292035 |
| 54 | 69.74 | 71.090629469817 | -1.35062946981707 |
| 55 | 152.58 | 168.445014351488 | -15.8650143514880 |
| 56 | 146.59 | 155.090772435856 | -8.50077243585612 |
| 57 | 161.16 | 176.596671321419 | -15.4366713214193 |
| 58 | 152.84 | 161.537357381557 | -8.6973573815568 |
| 59 | 121.95 | 144.088538684629 | -22.1385386846294 |
| 60 | 140.12 | 152.381710740875 | -12.2617107408748 |
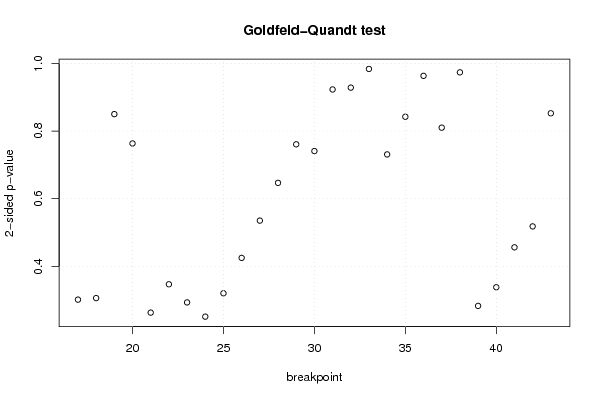
| Goldfeld-Quandt test for Heteroskedasticity | |||
| p-values | Alternative Hypothesis | ||
| breakpoint index | greater | 2-sided | less |
| 17 | 0.150718425174248 | 0.301436850348497 | 0.849281574825752 |
| 18 | 0.153024859832122 | 0.306049719664243 | 0.846975140167878 |
| 19 | 0.425149483749393 | 0.850298967498787 | 0.574850516250607 |
| 20 | 0.618249588359308 | 0.763500823281384 | 0.381750411640692 |
| 21 | 0.868491643480913 | 0.263016713038175 | 0.131508356519087 |
| 22 | 0.826569007658813 | 0.346861984682373 | 0.173430992341187 |
| 23 | 0.853363959623509 | 0.293272080752983 | 0.146636040376491 |
| 24 | 0.874450091825156 | 0.251099816349689 | 0.125549908174844 |
| 25 | 0.839884354169293 | 0.320231291661414 | 0.160115645830707 |
| 26 | 0.787531557690269 | 0.424936884619462 | 0.212468442309731 |
| 27 | 0.732403290838485 | 0.53519341832303 | 0.267596709161515 |
| 28 | 0.676543182420977 | 0.646913635158046 | 0.323456817579023 |
| 29 | 0.619515948209732 | 0.760968103580536 | 0.380484051790268 |
| 30 | 0.629509618921376 | 0.740980762157249 | 0.370490381078624 |
| 31 | 0.538371676379524 | 0.923256647240953 | 0.461628323620476 |
| 32 | 0.535680895302763 | 0.928638209394474 | 0.464319104697237 |
| 33 | 0.508037818245171 | 0.983924363509657 | 0.491962181754829 |
| 34 | 0.63446422363152 | 0.73107155273696 | 0.36553577636848 |
| 35 | 0.578746528261672 | 0.842506943476656 | 0.421253471738328 |
| 36 | 0.481763771034391 | 0.963527542068783 | 0.518236228965609 |
| 37 | 0.405105855634804 | 0.810211711269609 | 0.594894144365196 |
| 38 | 0.486928444646557 | 0.973856889293114 | 0.513071555353443 |
| 39 | 0.858547290219797 | 0.282905419560407 | 0.141452709780203 |
| 40 | 0.830962583485379 | 0.338074833029243 | 0.169037416514621 |
| 41 | 0.771875183865842 | 0.456249632268315 | 0.228124816134158 |
| 42 | 0.740924480530347 | 0.518151038939306 | 0.259075519469653 |
| 43 | 0.573601301142475 | 0.85279739771505 | 0.426398698857525 |
| Meta Analysis of Goldfeld-Quandt test for Heteroskedasticity | |||
| Description | # significant tests | % significant tests | OK/NOK |
| 1% type I error level | 0 | 0 | OK |
| 5% type I error level | 0 | 0 | OK |
| 10% type I error level | 0 | 0 | OK |