| Multiple Linear Regression - Estimated Regression Equation |
| inflatie[t] = + 0.972023860168438 + 0.098796834385658inflatie_levensmiddelen[t] + 0.058818758366768M1[t] + 0.00144070596005138M2[t] + 0.0240626535533356M3[t] -0.137267272228807M4[t] + 0.00116216886618223M5[t] + 0.0297119265226059M6[t] -0.0135939359472494M7[t] -0.0289960516662525M8[t] + 0.0116499592393184M9[t] -0.103752156479684M10[t] -0.0431061455741136M11[t] + 0.0193539890944291t + e[t] |
| Multiple Linear Regression - Ordinary Least Squares | |||||
| Variable | Parameter | S.D. | T-STAT H0: parameter = 0 | 2-tail p-value | 1-tail p-value |
| (Intercept) | 0.972023860168438 | 0.136163 | 7.1387 | 0 | 0 |
| inflatie_levensmiddelen | 0.098796834385658 | 0.014819 | 6.6669 | 0 | 0 |
| M1 | 0.058818758366768 | 0.161693 | 0.3638 | 0.717735 | 0.358868 |
| M2 | 0.00144070596005138 | 0.161603 | 0.0089 | 0.992926 | 0.496463 |
| M3 | 0.0240626535533356 | 0.161545 | 0.149 | 0.882256 | 0.441128 |
| M4 | -0.137267272228807 | 0.161507 | -0.8499 | 0.399873 | 0.199936 |
| M5 | 0.00116216886618223 | 0.161604 | 0.0072 | 0.994294 | 0.497147 |
| M6 | 0.0297119265226059 | 0.161714 | 0.1837 | 0.85505 | 0.427525 |
| M7 | -0.0135939359472494 | 0.161757 | -0.084 | 0.933398 | 0.466699 |
| M8 | -0.0289960516662525 | 0.161905 | -0.1791 | 0.858669 | 0.429334 |
| M9 | 0.0116499592393184 | 0.162044 | 0.0719 | 0.943005 | 0.471502 |
| M10 | -0.103752156479684 | 0.162264 | -0.6394 | 0.525803 | 0.262901 |
| M11 | -0.0431061455741136 | 0.162465 | -0.2653 | 0.79197 | 0.395985 |
| t | 0.0193539890944291 | 0.002171 | 8.9162 | 0 | 0 |
| Multiple Linear Regression - Regression Statistics | |
| Multiple R | 0.92103391960866 |
| R-squared | 0.84830348106969 |
| Adjusted R-squared | 0.8044800422676 |
| F-TEST (value) | 19.3573006650780 |
| F-TEST (DF numerator) | 13 |
| F-TEST (DF denominator) | 45 |
| p-value | 3.10862446895044e-14 |
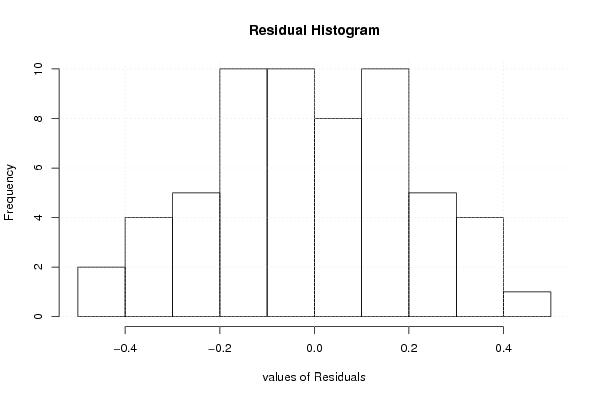
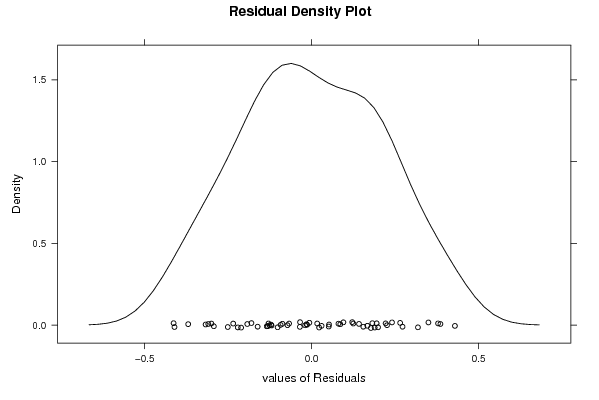
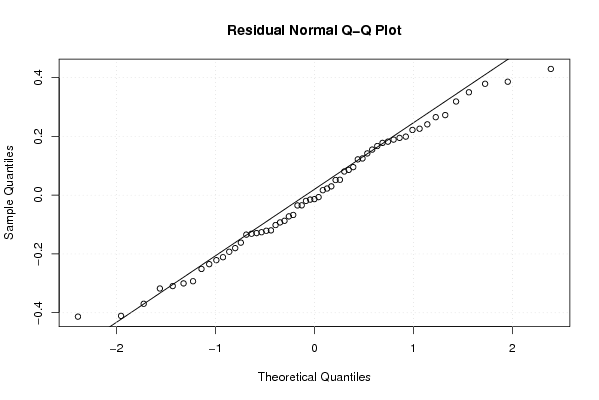
| Multiple Linear Regression - Residual Statistics | |
| Residual Standard Deviation | 0.240635030923153 |
| Sum Squared Residuals | 2.6057348148324 |
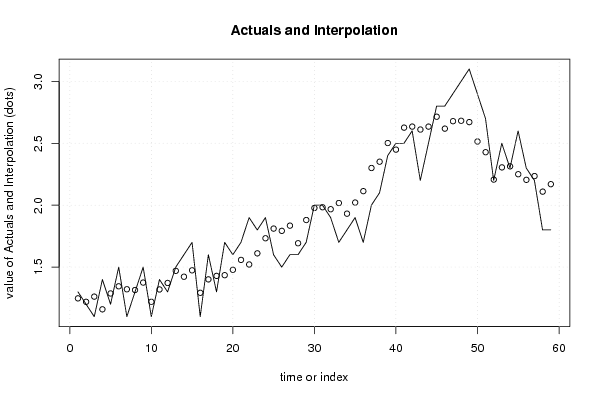
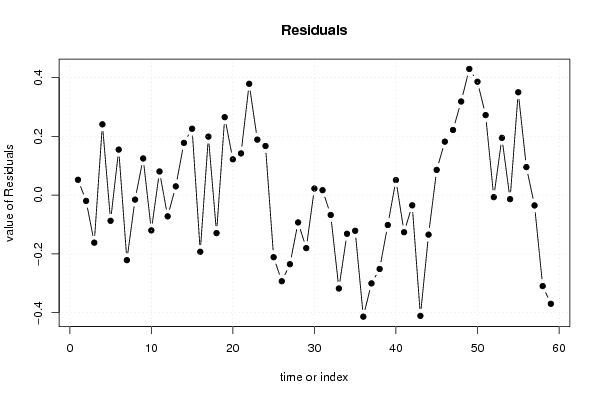
| Multiple Linear Regression - Actuals, Interpolation, and Residuals | |||
| Time or Index | Actuals | Interpolation Forecast | Residuals Prediction Error |
| 1 | 1.3 | 1.24779027640095 | 0.0522097235990519 |
| 2 | 1.2 | 1.21964589652723 | -0.0196458965272296 |
| 3 | 1.1 | 1.26162183321494 | -0.161621833214943 |
| 4 | 1.4 | 1.15916463028149 | 0.240835369718507 |
| 5 | 1.2 | 1.28730901015521 | -0.087309010155214 |
| 6 | 1.5 | 1.34509244034463 | 0.154907559655368 |
| 7 | 1.1 | 1.32114056696921 | -0.221140566969206 |
| 8 | 1.3 | 1.31521275690607 | -0.0152127569060665 |
| 9 | 1.5 | 1.37521275690607 | 0.124787243093934 |
| 10 | 1.1 | 1.21988652965010 | -0.119886529650098 |
| 11 | 1.4 | 1.31964589652723 | 0.0803541034727705 |
| 12 | 1.3 | 1.37222634775721 | -0.0722263477572063 |
| 13 | 1.5 | 1.47015846209553 | 0.0298415379044651 |
| 14 | 1.6 | 1.42225471534468 | 0.177745284655318 |
| 15 | 1.7 | 1.47411033547096 | 0.225889664529039 |
| 16 | 1.1 | 1.29261566502898 | -0.192615665028984 |
| 17 | 1.6 | 1.40100067802557 | 0.198999321974426 |
| 18 | 1.3 | 1.42914505789929 | -0.129145057899295 |
| 19 | 1.7 | 1.43483223483957 | 0.265167765160434 |
| 20 | 1.6 | 1.47830284196926 | 0.121697158030745 |
| 21 | 1.7 | 1.55806220884639 | 0.141937791153613 |
| 22 | 1.9 | 1.52129218285321 | 0.378707817146792 |
| 23 | 1.8 | 1.61117186629177 | 0.188828133708226 |
| 24 | 1.9 | 1.73291010159171 | 0.167089898408289 |
| 25 | 1.6 | 1.81108284905291 | -0.211082849052908 |
| 26 | 1.5 | 1.79281815261775 | -0.292818152617752 |
| 27 | 1.6 | 1.83479408930547 | -0.234794089305466 |
| 28 | 1.6 | 1.69281815261775 | -0.0928181526177524 |
| 29 | 1.7 | 1.88024063312287 | -0.180240633122868 |
| 30 | 2 | 1.97754279706655 | 0.02245720293345 |
| 31 | 2 | 1.98322997400682 | 0.0167700259931787 |
| 32 | 1.9 | 1.96742248050512 | -0.0674224805051158 |
| 33 | 1.7 | 2.01754279706655 | -0.31754279706655 |
| 34 | 1.8 | 1.93137435388054 | -0.131374353880542 |
| 35 | 1.9 | 2.02125403731911 | -0.121254037319108 |
| 36 | 1.7 | 2.11335322230335 | -0.413353222303348 |
| 37 | 2 | 2.30020248758877 | -0.300202487588769 |
| 38 | 2.1 | 2.35109557522357 | -0.251095575223573 |
| 39 | 2.4 | 2.50174802973551 | -0.101748029735511 |
| 40 | 2.5 | 2.44868924399489 | 0.0513107560051105 |
| 41 | 2.5 | 2.62623204106144 | -0.126232041061440 |
| 42 | 2.6 | 2.63461705405803 | -0.0346170540580291 |
| 43 | 2.2 | 2.6106651806826 | -0.410665180682603 |
| 44 | 2.5 | 2.63437642093516 | -0.134376420935161 |
| 45 | 2.8 | 2.71413578781229 | 0.0858642121877074 |
| 46 | 2.8 | 2.61808766118772 | 0.181912338812281 |
| 47 | 2.9 | 2.67832829431059 | 0.221671705689413 |
| 48 | 3 | 2.68151032834774 | 0.318489671652265 |
| 49 | 3.1 | 2.67076592486184 | 0.42923407513816 |
| 50 | 2.9 | 2.51418566028676 | 0.385814339713237 |
| 51 | 2.7 | 2.42772571227312 | 0.27227428772688 |
| 52 | 2.2 | 2.20671230807688 | -0.0067123080768805 |
| 53 | 2.5 | 2.30521763763490 | 0.194782362365096 |
| 54 | 2.3 | 2.31360265063149 | -0.0136026506314939 |
| 55 | 2.6 | 2.25013204350180 | 0.349867956498196 |
| 56 | 2.3 | 2.2046854996844 | 0.0953145003155984 |
| 57 | 2.2 | 2.23504644936870 | -0.0350464493687038 |
| 58 | 1.8 | 2.10935927242843 | -0.309359272428433 |
| 59 | 1.8 | 2.1695999055513 | -0.369599905551301 |
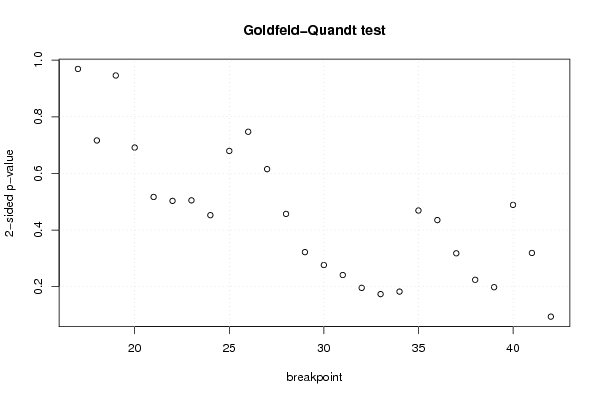
| Goldfeld-Quandt test for Heteroskedasticity | |||
| p-values | Alternative Hypothesis | ||
| breakpoint index | greater | 2-sided | less |
| 17 | 0.515555238040539 | 0.968889523918922 | 0.484444761959461 |
| 18 | 0.358196684731949 | 0.716393369463899 | 0.64180331526805 |
| 19 | 0.472901313774787 | 0.945802627549575 | 0.527098686225213 |
| 20 | 0.345628013870725 | 0.691256027741449 | 0.654371986129275 |
| 21 | 0.258403102832187 | 0.516806205664375 | 0.741596897167813 |
| 22 | 0.251483645480160 | 0.502967290960319 | 0.74851635451984 |
| 23 | 0.252400783389724 | 0.504801566779448 | 0.747599216610276 |
| 24 | 0.22621963946209 | 0.45243927892418 | 0.77378036053791 |
| 25 | 0.339669519259095 | 0.679339038518191 | 0.660330480740905 |
| 26 | 0.373520612656271 | 0.747041225312541 | 0.62647938734373 |
| 27 | 0.307539437034663 | 0.615078874069326 | 0.692460562965337 |
| 28 | 0.228418870569766 | 0.456837741139533 | 0.771581129430233 |
| 29 | 0.160955303070555 | 0.32191060614111 | 0.839044696929445 |
| 30 | 0.13818734996896 | 0.27637469993792 | 0.86181265003104 |
| 31 | 0.120510067046503 | 0.241020134093006 | 0.879489932953497 |
| 32 | 0.0978689251809265 | 0.195737850361853 | 0.902131074819073 |
| 33 | 0.086805863048793 | 0.173611726097586 | 0.913194136951207 |
| 34 | 0.0912315887006142 | 0.182463177401228 | 0.908768411299386 |
| 35 | 0.234433144337484 | 0.468866288674968 | 0.765566855662516 |
| 36 | 0.217552896758519 | 0.435105793517037 | 0.782447103241481 |
| 37 | 0.158904570819950 | 0.317809141639901 | 0.84109542918005 |
| 38 | 0.112105190551235 | 0.224210381102471 | 0.887894809448765 |
| 39 | 0.0990504014529217 | 0.198100802905843 | 0.900949598547078 |
| 40 | 0.244351239833215 | 0.48870247966643 | 0.755648760166785 |
| 41 | 0.159506752816504 | 0.319013505633008 | 0.840493247183496 |
| 42 | 0.952977087059852 | 0.0940458258802967 | 0.0470229129401484 |
| Meta Analysis of Goldfeld-Quandt test for Heteroskedasticity | |||
| Description | # significant tests | % significant tests | OK/NOK |
| 1% type I error level | 0 | 0 | OK |
| 5% type I error level | 0 | 0 | OK |
| 10% type I error level | 1 | 0.0384615384615385 | OK |